Gallery
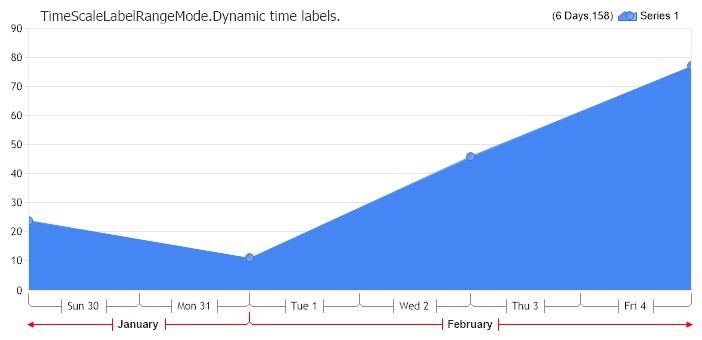
Axis Tick Auto Range Time Labels
<%@ Page Language="C#" Description="dotnetCHARTING Component" %>
<%@ Register TagPrefix="dotnet" Namespace="dotnetCHARTING" Assembly="dotnetCHARTING"%>
<%@ Import Namespace="System.Drawing" %>
<%@ Import Namespace="System.Drawing.Drawing2D" %>
<html xmlns="http://www.w3.org/1999/xhtml">
<head>
<title>.netCHARTING Sample</title>
<script runat="server">
void Page_Load(Object sender,EventArgs e)
{
Chart.Type = ChartType.Combo;//Horizontal;
Chart.Width = 700;
Chart.Height = 350;
Chart.TempDirectory = "temp";
Chart.Debug = true;
Chart.Title = "TimeScaleLabelRangeMode.Dynamic time labels.";
Chart.DefaultSeries.Type=SeriesType.AreaLine;
Chart.TitleBox.Position = TitleBoxPosition.FullWithLegend;
Chart.ChartArea.Line.Color = Color.FromArgb(236, 236, 236);
Chart.ChartArea.Line.Width = 1;
// Demonstrates how to use axis time label automation and how to specify different
// properties for time labels representing different instances in time.
// Specify the mode.
Chart.XAxis.TimeScaleLabels.Mode = TimeScaleLabelMode.Hidden;
Chart.XAxis.TimeScaleLabels.RangeMode = TimeScaleLabelRangeMode.Dynamic;
// Specify a format string for day labels.
Chart.XAxis.TimeScaleLabels.DayFormatString = "ddd d";
// Specify a label template and font for month labels.
Chart.XAxis.TimeScaleLabels.MonthTick.Label.Font = new Font("Arial",8,FontStyle.Bold);
Chart.XAxis.TimeScaleLabels.MonthTick.Line.Color = Color.Red;
// *DYNAMIC DATA NOTE*
// This sample uses random data to populate the chart. To populate
// a chart with database data see the following resources:
// - Classic samples folder
// - Help File > Data Tutorials
// - Sample: features/DataEngine.aspx
// Add the random data.
Chart.SeriesCollection.Add(getRandomData());
}
SeriesCollection getRandomData()
{
SeriesCollection SC = new SeriesCollection();
Random myR = new Random(1);
DateTime dt = new DateTime(2005,1,28);
for(int a = 1; a < 2; a++)
{
Series s = new Series();
s.Name = "Series " + a;
for(int b = 1; b < 5; b++)
{
Element e = new Element();
e.YValue = myR.Next(100);
e.XDateTime = dt = dt.AddDays(2);
s.Elements.Add(e);
}
SC.Add(s);
}
return SC;
}
</script>
</head>
<body>
<div style="text-align:center">
<dotnet:Chart id="Chart" runat="server" Width="568px" Height="344px">
</dotnet:Chart>
</div>
</body>
</html>
<%@ Page Language="vb" Description="dotnetCHARTING Component" %>
<%@ Register TagPrefix="dotnet" Namespace="dotnetCHARTING" Assembly="dotnetCHARTING"%>
<%@ Import Namespace="System.Drawing" %>
<%@ Import Namespace="System.Drawing.Drawing2D" %>
<html xmlns="http://www.w3.org/1999/xhtml">
<head>
<title>.netCHARTING Sample</title>
<script runat="server">
Sub Page_Load(ByVal sender As Object, ByVal e As EventArgs)
Chart.Type = ChartType.Combo 'Horizontal;
Chart.Width = 700
Chart.Height = 350
Chart.TempDirectory = "temp"
Chart.Debug = True
Chart.Title = "TimeScaleLabelRangeMode.Dynamic time labels."
Chart.DefaultSeries.Type=SeriesType.AreaLine
Chart.TitleBox.Position = TitleBoxPosition.FullWithLegend
Chart.ChartArea.Line.Color = Color.FromArgb(236, 236, 236)
Chart.ChartArea.Line.Width = 1
' Demonstrates how to use axis time label automation and how to specify different
' properties for time labels representing different instances in time.
' Specify the mode.
Chart.XAxis.TimeScaleLabels.Mode = TimeScaleLabelMode.Hidden
Chart.XAxis.TimeScaleLabels.RangeMode = TimeScaleLabelRangeMode.Dynamic
' Specify a format string for day labels.
Chart.XAxis.TimeScaleLabels.DayFormatString = "ddd d"
' Specify a label template and font for month labels.
Chart.XAxis.TimeScaleLabels.MonthTick.Label.Font = New Font("Arial",8,FontStyle.Bold)
Chart.XAxis.TimeScaleLabels.MonthTick.Line.Color = Color.Red
' *DYNAMIC DATA NOTE*
' This sample uses random data to populate the chart. To populate
' a chart with database data see the following resources:
' - Classic samples folder
' - Help File > Data Tutorials
' - Sample: features/DataEngine.aspx
' Add the random data.
Chart.SeriesCollection.Add(getRandomData())
End Sub
Function getRandomData() As SeriesCollection
Dim SC As SeriesCollection = New SeriesCollection()
Dim myR As Random = New Random(1)
Dim dt As DateTime = New DateTime(2005,1,28)
For a As Integer = 1 To 1
Dim s As Series = New Series()
s.Name = "Series " & a
For b As Integer = 1 To 4
Dim e As Element = New Element()
e.YValue = myR.Next(100)
dt = dt.AddDays(2)
e.XDateTime = dt
s.Elements.Add(e)
Next b
SC.Add(s)
Next a
Return SC
End Function
</script>
</head>
<body>
<div style="text-align:center">
<dotnet:Chart id="Chart" runat="server" Width="568px" Height="344px">
</dotnet:Chart>
</div>
</body>
</html>
- Sample FilenameAxisTickAutoRangeTimeLabels.aspx
- VersionLegacy (Pre 3.0)
- Uses DatabaseNo