Gallery
Arbitrary Ticks
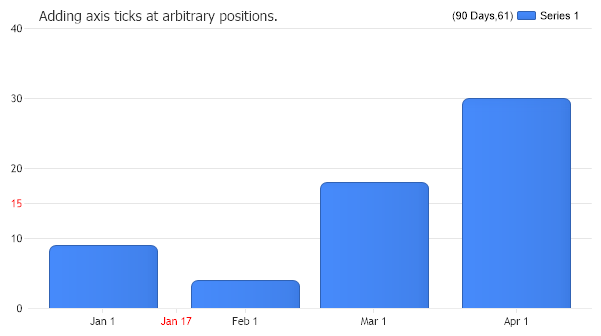
How ticks can be added at any position on an axis scale. A numeric tick is added to the y axis and a DateTime value tick is added to the x axis.
- Sample FilenameArbitraryTicks.aspx
- VersionLegacy (Pre 3.0)
- Uses DatabaseNo