Gallery
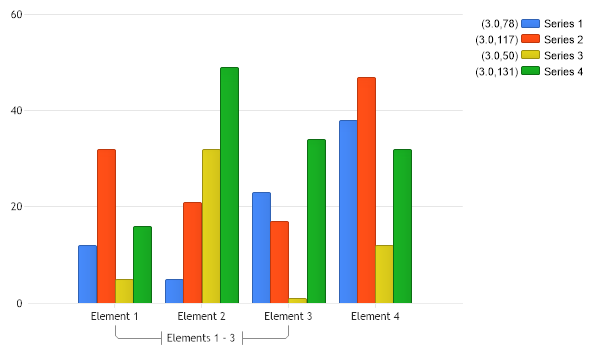
Axis Range Text Ticks
<%@ Page Language="C#" Description="dotnetCHARTING Component" %>
<%@ Register TagPrefix="dotnet" Namespace="dotnetCHARTING" Assembly="dotnetCHARTING"%>
<%@ Import Namespace="System.Drawing" %>
<%@ Import Namespace="System.Drawing.Drawing2D" %>
<html xmlns="http://www.w3.org/1999/xhtml">
<head>
<title>.netCHARTING Sample</title>
<script runat="server">
void Page_Load(Object sender,EventArgs e)
{
Chart.Type = ChartType.Combo;//Horizontal;
Chart.Size = "600x350";
Chart.TempDirectory = "temp";
Chart.Debug = true;
//Chart.Title = ".netCHARTING Sample";
Chart.DefaultElement.ToolTip = "%Name";
// Demonstrates how range ticks can be used with a category x axis scale.
// *DYNAMIC DATA NOTE*
// This sample uses random data to populate the chart. To populate
// a chart with database data see the following resources:
// - Classic samples folder
// - Help File > Data Tutorials
// - Sample: features/DataEngine.aspx
SeriesCollection mySC = getRandomData();
// First we'll give each element a numeric x value because the range ticks work with numbers and dates.
// At the same time we'll override numeric axis ticks the the correct text.
for(int i = 0; i < mySC[0].Elements.Count;i++)
{
for(int ii = 0; ii < mySC.Count;ii++)
{
mySC[ii][i].XValue = i;
}
AxisTick at = new AxisTick(i,mySC[0][i].Name);
Chart.XAxis.ExtraTicks.Add(at);
}
Chart.XAxis.Scale = Scale.Normal;
Chart.XAxis.ClearValues = true;
// Finally, we'll add the range tick.
Chart.XAxis.ExtraTicks.Add(new AxisTick(0,2,"Elements 1 - 3"));
// Add the random data.
Chart.SeriesCollection.Add(mySC);
}
SeriesCollection getRandomData()
{
SeriesCollection SC = new SeriesCollection();
Random myR = new Random(1);
for(int a = 1; a < 5; a++)
{
Series s = new Series();
s.Name = "Series " + a.ToString();
for(int b = 1; b < 5; b++)
{
Element e = new Element();
e.Name = "Element " + b.ToString();
e.YValue = myR.Next(50);
s.Elements.Add(e);
}
SC.Add(s);
}
return SC;
}
</script>
</head>
<body>
<div style="text-align:center">
<dotnet:Chart id="Chart" runat="server" Width="568px" Height="344px">
</dotnet:Chart>
</div>
</body>
</html>
<%@ Page Language="vb" Description="dotnetCHARTING Component" %>
<%@ Register TagPrefix="dotnet" Namespace="dotnetCHARTING" Assembly="dotnetCHARTING"%>
<%@ Import Namespace="System.Drawing" %>
<%@ Import Namespace="System.Drawing.Drawing2D" %>
<html xmlns="http://www.w3.org/1999/xhtml">
<head>
<title>.netCHARTING Sample</title>
<script runat="server">
Sub Page_Load(ByVal sender As Object, ByVal e As EventArgs)
Chart.Type = ChartType.Combo 'Horizontal;
Chart.Size = "600x350"
Chart.TempDirectory = "temp"
Chart.Debug = True
'Chart.Title = ".netCHARTING Sample";
Chart.DefaultElement.ToolTip = "%Name"
' Demonstrates how range ticks can be used with a category x axis scale.
' *DYNAMIC DATA NOTE*
' This sample uses random data to populate the chart. To populate
' a chart with database data see the following resources:
' - Classic samples folder
' - Help File > Data Tutorials
' - Sample: features/DataEngine.aspx
Dim mySC As SeriesCollection = getRandomData()
' First we'll give each element a numeric x value because the range ticks work with numbers and dates.
' At the same time we'll override numeric axis ticks the the correct text.
For i As Integer = 0 To mySC(0).Elements.Count - 1
For ii As Integer = 0 To mySC.Count - 1
mySC(ii)(i).XValue = i
Next ii
Dim at As AxisTick = New AxisTick(i,mySC(0)(i).Name)
Chart.XAxis.ExtraTicks.Add(at)
Next i
Chart.XAxis.Scale = Scale.Normal
Chart.XAxis.ClearValues = True
' Finally, we'll add the range tick.
Chart.XAxis.ExtraTicks.Add(New AxisTick(0,2,"Elements 1 - 3"))
' Add the random data.
Chart.SeriesCollection.Add(mySC)
End Sub
Function getRandomData() As SeriesCollection
Dim SC As SeriesCollection = New SeriesCollection()
Dim myR As Random = New Random(1)
For a As Integer = 1 To 4
Dim s As Series = New Series()
s.Name = "Series " & a.ToString()
For b As Integer = 1 To 4
Dim e As Element = New Element()
e.Name = "Element " & b.ToString()
e.YValue = myR.Next(50)
s.Elements.Add(e)
Next b
SC.Add(s)
Next a
Return SC
End Function
</script>
</head>
<body>
<div style="text-align:center">
<dotnet:Chart id="Chart" runat="server" Width="568px" Height="344px">
</dotnet:Chart>
</div>
</body>
</html>
- Sample FilenameAxisRangeTextTicks.aspx
- Version3.4
- Uses DatabaseNo