// Demonstrates how axis ticks can show data totals.
// *DYNAMIC DATA NOTE* // This sample uses random data to populate the chart. To populate // a chart with database data see the following resources: // - Classic samples folder // - Help File > Data Tutorials // - Sample: features/DataEngine.aspx SeriesCollection mySC = getRandomData();
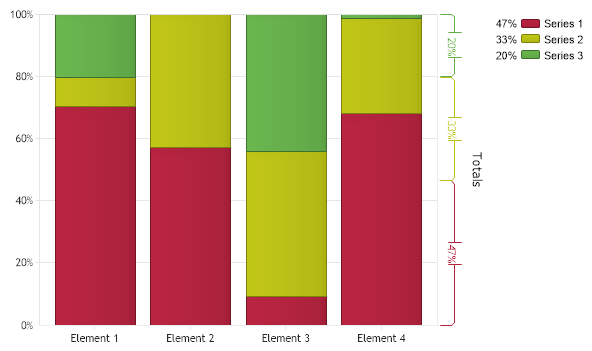
// Setup the y axis and chart colors. Chart.YAxis.Scale = Scale.FullStacked; Chart.YAxis.DefaultTick.Label.Text = "%value%"; Chart.PaletteName = Palette.Three;
// Create the shadow axis and add it. Axis shadow = Chart.YAxis.Calculate("Totals"); shadow.Orientation = dotnetCHARTING.Orientation.Right; shadow.ClearValues = true; Chart.AxisCollection.Add(shadow);
// Do some calculations double sum = mySC.Calculate("",Calculation.Sum).Calculate("",Calculation.Sum).YValue; double s1Sum = mySC[0].Calculate("",Calculation.Sum).YValue; double s2Sum = mySC[1].Calculate("",Calculation.Sum).YValue; double s3Sum = mySC[2].Calculate("",Calculation.Sum).YValue; double runningSum = 0; double currentValue = 0;
currentValue = s1Sum*100/sum;
// Create the axis ticks and set their colors based on the chart palette. AxisTick tickA = new AxisTick(runningSum,currentValue+runningSum); tickA.Label.Text = currentValue.ToString("0") + "%"; tickA.Label.Color = tickA.Line.Color = Chart.Palette[0];
// Add the extra ticks. shadow.ExtraTicks.Add(tickA, tickB, tickC);
// Add the random data. Chart.SeriesCollection.Add(mySC);
}
SeriesCollection getRandomData() { SeriesCollection SC = new SeriesCollection(); Random myR = new Random(2); for(int a = 1; a < 4; a++) { Series s = new Series(); s.Name = "Series " + a; for(int b = 1; b < 5; b++) { Element e = new Element(); e.Name = "Element " + b; e.YValue = myR.Next(50); s.Elements.Add(e); } SC.Add(s); }
' Demonstrates how axis ticks can show data totals.
' *DYNAMIC DATA NOTE* ' This sample uses random data to populate the chart. To populate ' a chart with database data see the following resources: ' - Classic samples folder ' - Help File > Data Tutorials ' - Sample: features/DataEngine.aspx Dim mySC As SeriesCollection = getRandomData()
' Setup the y axis and chart colors. Chart.YAxis.Scale = Scale.FullStacked Chart.YAxis.DefaultTick.Label.Text = "%value%" Chart.PaletteName = Palette.Three
' Create the shadow axis and add it. Dim shadow As Axis = Chart.YAxis.Calculate("Totals") shadow.Orientation = dotnetCHARTING.Orientation.Right shadow.ClearValues = True Chart.AxisCollection.Add(shadow)
' Do some calculations Dim sum As Double = mySC.Calculate("",Calculation.Sum).Calculate("",Calculation.Sum).YValue Dim s1Sum As Double = mySC(0).Calculate("",Calculation.Sum).YValue Dim s2Sum As Double = mySC(1).Calculate("",Calculation.Sum).YValue Dim s3Sum As Double = mySC(2).Calculate("",Calculation.Sum).YValue Dim runningSum As Double = 0 Dim currentValue As Double = 0
currentValue = s1Sum*100/sum
' Create the axis ticks and set their colors based on the chart palette. Dim tickA As AxisTick = New AxisTick(runningSum,currentValue+runningSum) tickA.Label.Text = currentValue.ToString("0") & "%" tickA.Line.Color = Chart.Palette(0) tickA.Label.Color = tickA.Line.Color
Dim tickC As AxisTick = New AxisTick(runningSum,currentValue+runningSum) tickC.Label.Text = currentValue.ToString("0") & "%" tickC.Line.Color = Chart.Palette(2) tickC.Label.Color = tickC.Line.Color
' Add the extra ticks. shadow.ExtraTicks.Add(tickA, tickB, tickC)
' Add the random data. Chart.SeriesCollection.Add(mySC)
End Sub
Function getRandomData() As SeriesCollection Dim SC As SeriesCollection = New SeriesCollection() Dim myR As Random = New Random(2) For a As Integer = 1 To 3 Dim s As Series = New Series() s.Name = "Series " & a For b As Integer = 1 To 4 Dim e As Element = New Element() e.Name = "Element " & b e.YValue = myR.Next(50) s.Elements.Add(e) Next b SC.Add(s) Next a
Return SC End Function </script> </head> <body> <div style="text-align:center"> <dotnet:Chart id="Chart" runat="server" Width="568px" Height="344px"> </dotnet:Chart> </div> </body> </html>