Gallery
Custom Function
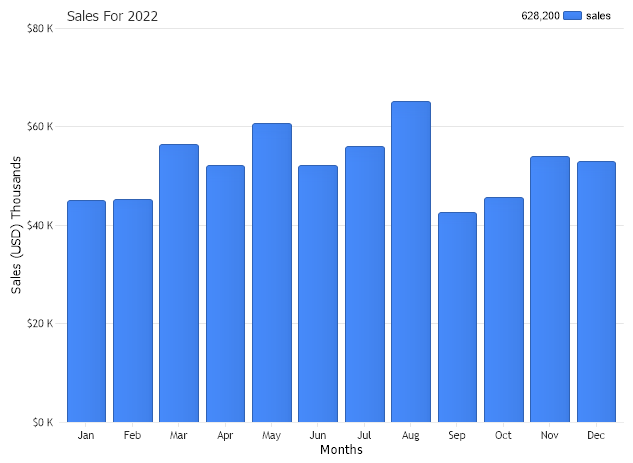
Demonstrates the usage of a custom function to transform the axis tick labels.
- Sample FilenameCustomFunction.aspx
- VersionLegacy (Pre 3.0)
- Uses DatabaseYes