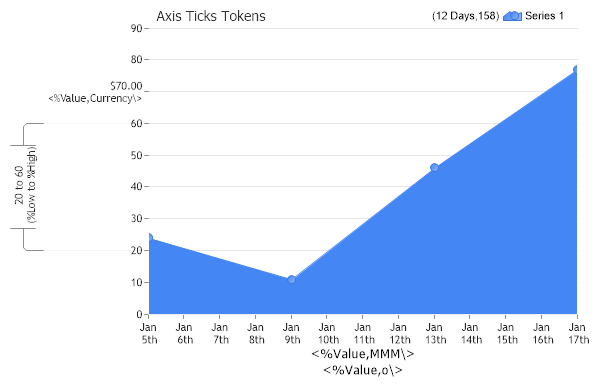
Gallery
Axis Tick Token
<%@ Page Language="C#" Description="dotnetCHARTING Component" %>
<%@ Register TagPrefix="dotnet" Namespace="dotnetCHARTING" Assembly="dotnetCHARTING"%>
<%@ Import Namespace="System.Drawing" %>
<html xmlns="http://www.w3.org/1999/xhtml">
<head>
<title>.netCHARTING Sample</title>
<script runat="server">
void Page_Load(Object sender,EventArgs e)
{
// Demonstrates how to use the %Value token with value axis ticks and manipulate their labels.
Chart.Type = ChartType.Combo;//Horizontal;
Chart.Width = 600;
Chart.Height = 400;
Chart.TempDirectory = "temp";
Chart.Debug = true;
Chart.Title = "Axis Ticks Tokens";
Chart.DefaultSeries.Type=SeriesType.AreaLine;
Chart.TitleBox.Position = TitleBoxPosition.FullWithLegend;
Chart.XAxis.Label.Text = "\\<\\%Value,MMM\\>\n\\<\\%Value,o\\>";
// X Axis label.
Chart.XAxis.DefaultTick.Label.Text = "<%Value,MMM> \n <%Value,o>";
// Setup new axis ticks to.
AxisTick at = new AxisTick(20, 60, "%Low to %High\n(\\%Low to \\%High)");
AxisTick at2 = new AxisTick(70, "<%Value,Currency>\n\\<\\%Value,Currency\\>");
// Add the new ticks.
Chart.YAxis.ExtraTicks.Add(at, at2);
Chart.DefaultAxis.DefaultTick.Line.Color = Color.FromArgb(140, 140, 140);
// *DYNAMIC DATA NOTE*
// This sample uses random data to populate the chart. To populate
// a chart with database data see the following resources:
// - Classic samples folder
// - Help File > Data Tutorials
// - Sample: features/DataEngine.aspx
// Add the random data.
Chart.SeriesCollection.Add(getRandomData());
}
SeriesCollection getRandomData()
{
SeriesCollection SC = new SeriesCollection();
Random myR = new Random(1);
DateTime dt = new DateTime(2021,1,1);
for(int a = 1; a < 2; a++)
{
Series s = new Series();
s.Name = "Series " + a;
for(int b = 1; b < 5; b++)
{
Element e = new Element();
e.YValue = myR.Next(100);
e.XDateTime = dt = dt.AddDays(4);
s.Elements.Add(e);
}
SC.Add(s);
}
return SC;
}
</script>
</head>
<body>
<div style="text-align:center">
<dotnet:Chart id="Chart" runat="server" Width="568px" Height="344px">
</dotnet:Chart>
</div>
</body>
</html>
<%@ Page Language="vb" Description="dotnetCHARTING Component" %>
<%@ Register TagPrefix="dotnet" Namespace="dotnetCHARTING" Assembly="dotnetCHARTING"%>
<%@ Import Namespace="System.Drawing" %>
<html xmlns="http://www.w3.org/1999/xhtml">
<head>
<title>.netCHARTING Sample</title>
<script runat="server">
Sub Page_Load(ByVal sender As Object, ByVal e As EventArgs)
' Demonstrates how to use the %Value token with value axis ticks and manipulate their labels.
Chart.Type = ChartType.Combo 'Horizontal;
Chart.Width = 600
Chart.Height = 400
Chart.TempDirectory = "temp"
Chart.Debug = True
Chart.Title = "Axis Ticks Tokens"
Chart.DefaultSeries.Type=SeriesType.AreaLine
Chart.TitleBox.Position = TitleBoxPosition.FullWithLegend
Chart.XAxis.Label.Text = "\<\%Value,MMM\>" & Constants.vbLf & "\<\%Value,o\>"
' X Axis label.
Chart.XAxis.DefaultTick.Label.Text = "<%Value,MMM> " & Constants.vbLf & " <%Value,o>"
' Setup new axis ticks to.
Dim at As AxisTick = New AxisTick(20, 60, "%Low to %High" & Constants.vbLf & "(\%Low to \%High)")
Dim at2 As AxisTick = New AxisTick(70, "<%Value,Currency>" & Constants.vbLf & "\<\%Value,Currency\>")
' Add the new ticks.
Chart.YAxis.ExtraTicks.Add(at, at2)
Chart.DefaultAxis.DefaultTick.Line.Color = Color.FromArgb(140, 140, 140)
' *DYNAMIC DATA NOTE*
' This sample uses random data to populate the chart. To populate
' a chart with database data see the following resources:
' - Classic samples folder
' - Help File > Data Tutorials
' - Sample: features/DataEngine.aspx
' Add the random data.
Chart.SeriesCollection.Add(getRandomData())
End Sub
Function getRandomData() As SeriesCollection
Dim SC As SeriesCollection = New SeriesCollection()
Dim myR As Random = New Random(1)
Dim dt As DateTime = New DateTime(2021,1,1)
For a As Integer = 1 To 1
Dim s As Series = New Series()
s.Name = "Series " & a
For b As Integer = 1 To 4
Dim e As Element = New Element()
e.YValue = myR.Next(100)
dt = dt.AddDays(4)
e.XDateTime = dt
s.Elements.Add(e)
Next b
SC.Add(s)
Next a
Return SC
End Function
</script>
</head>
<body>
<div style="text-align:center">
<dotnet:Chart id="Chart" runat="server" Width="568px" Height="344px">
</dotnet:Chart>
</div>
</body>
</html>
- Sample FilenameAxisTickToken.aspx
- VersionLegacy (Pre 3.0)
- Uses DatabaseNo