// Demonstrates how to create dynamic tick labels based on chart data.
// First we get our data, if you would like to get the data from a database you need to use // the data engine. See sample: features/dataEngine.aspx. Or the dataEngine tutorial in the help file. SeriesCollection sc = getRandomData();
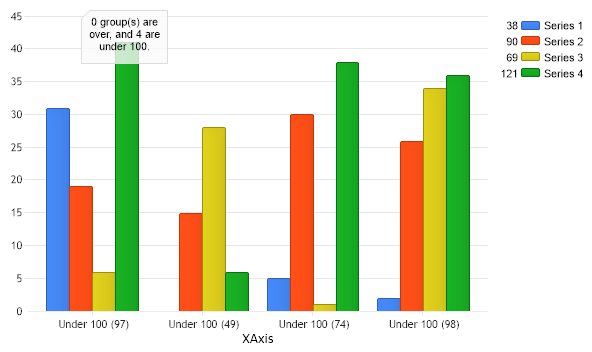
// Pass a simple string manipulation funtion to the x axis. Chart.XAxis = Chart.XAxis.Calculate("XAxis", new ChangeValueDelegate(MyFunction));
// Have the tick mark labels be the total value of the each ticks group of elements. Chart.XAxis.DefaultTick.Label.Text = "%Value";
// Each tick label will first become a value, then our function below will change the tick label based // the ticks value.
// To expand on this we'll use an annotation to show how many tick groups are over and under 100. // We have initialized an annotation and 2 counters below.
// Zero out the counters. underCount = 0; overCount = 0;
// Add the annotation to our chart. Chart.Annotations.Add(ann);
// Add the random data. Chart.SeriesCollection.Add(sc);
}
public static Annotation ann = new Annotation(); public static int underCount = 0; public static int overCount = 0;
public static string MyFunction(string value) { int num = int.Parse(value); string newLabel = ""; // Modify the string and increment counters. if(num > 100) { newLabel = " Over 100 (" + value + ")"; overCount++; } else { newLabel = " Under 100 (" + value + ")"; underCount++; }
// Update the annotation with the new count. ann.Label.Text = overCount + " group(s) are over, and " + underCount + " are under 100."; ann.Position = new Point(80,5);
return newLabel;
}
SeriesCollection getRandomData() { SeriesCollection SC = new SeriesCollection(); Random myR = new Random(); for(int a = 1; a < 5; a++) { Series s = new Series(); s.Name = "Series " + a; for(int b = 1; b < 5; b++) { Element e = new Element(); e.Name = "Element " + b; //e.YValue = -25 + myR.Next(50); e.YValue = myR.Next(50); s.Elements.Add(e); } SC.Add(s); } return SC; }
' Demonstrates how to create dynamic tick labels based on chart data.
' First we get our data, if you would like to get the data from a database you need to use ' the data engine. See sample: features/dataEngine.aspx. Or the dataEngine tutorial in the help file. Dim sc As SeriesCollection = getRandomData()
' Pass a simple string manipulation funtion to the x axis. Chart.XAxis = Chart.XAxis.Calculate("XAxis", New ChangeValueDelegate(AddressOf MyFunction))
' Have the tick mark labels be the total value of the each ticks group of elements. Chart.XAxis.DefaultTick.Label.Text = "%Value"
' Each tick label will first become a value, then our function below will change the tick label based ' the ticks value.
' To expand on this we'll use an annotation to show how many tick groups are over and under 100. ' We have initialized an annotation and 2 counters below.
' Zero out the counters. underCount = 0 overCount = 0
' Add the annotation to our chart. Chart.Annotations.Add(ann)
' Add the random data. Chart.SeriesCollection.Add(sc)
End Sub
Public Shared ann As Annotation = New Annotation() Public Shared underCount As Integer = 0 Public Shared overCount As Integer = 0
Public Shared Function MyFunction(ByVal value As String) As String Dim num As Integer = Integer.Parse(value) Dim newLabel As String = "" ' Modify the string and increment counters. If num > 100 Then newLabel = " Over 100 (" & value & ")" overCount += 1 Else newLabel = " Under 100 (" & value & ")" underCount += 1 End If
' Update the annotation with the new count. ann.Label.Text = overCount & " group(s) are over, and " & underCount & " are under 100." ann.Position = New Point(80,5)
Return newLabel
End Function
Function getRandomData() As SeriesCollection Dim SC As SeriesCollection = New SeriesCollection() Dim myR As Random = New Random() For a As Integer = 1 To 4 Dim s As Series = New Series() s.Name = "Series " & a For b As Integer = 1 To 4 Dim e As Element = New Element() e.Name = "Element " & b 'e.YValue = -25 + myR.Next(50); e.YValue = myR.Next(50) s.Elements.Add(e) Next b SC.Add(s) Next a Return SC End Function