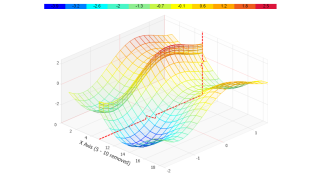
- Surface Axis Custom Ticks
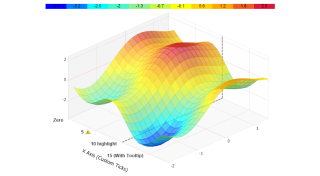
Demonstrates using custom axis ticks with a 3D surface chart.
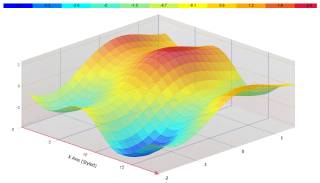
- Surface Axis Invert Scale
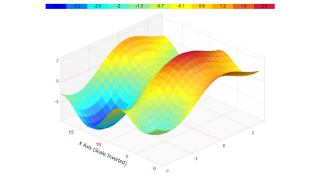
Demonstrates using an inverted scale.
- Surface Axis Labels
Demonstrates how labels can be used on axes with surface charts.
- Surface Axis Log Scale
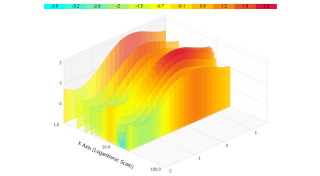
Demonstrates using logarithmic scales on a surface chart.
- Surface Axis Scale Break
Demonstrates using scale breaks on surface charts.
- Surface Axis Styling
Demonstrates styling axis lines and chart area of a surface chart.
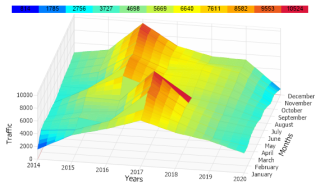
- Surface Date Grouping
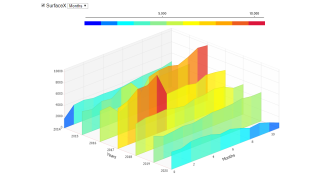
Demonstrates creating a surface chart from live time based data.
- Surface Designer
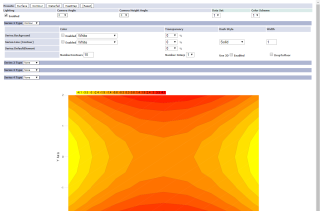
Demonstrates usage of the box header properties and code to generate them.
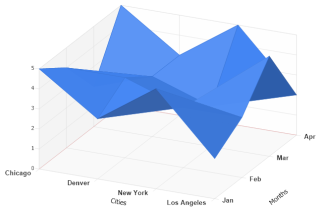
- Surface From Category Data
Demonstrates how to draw a surface chart from category based series where elements use names for x axis values.
- Surface From Elements
Demonstrates how to populate a surface chart by creating elements.
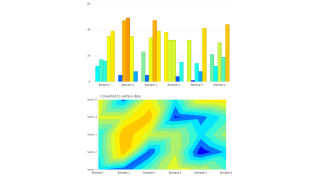
- Surface Time DB
Demonstrates how normal chart data can be converted into surface data.
- Surface Image Heatmap
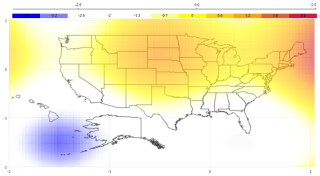
Demonstrates a 2D heatmap with transparent colors overlaying an image.
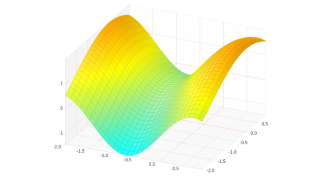
- Surface Lighting
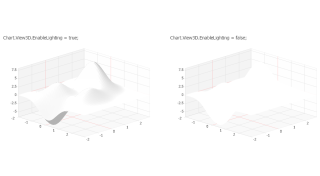
Demonstrates the effect of Disabling 3D lighting.
- Surface Views
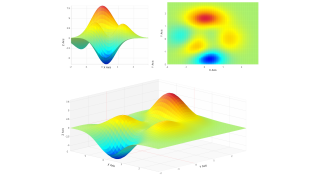
Demonstrates creating multiple views of 3D data.
- Surface Views Transparent
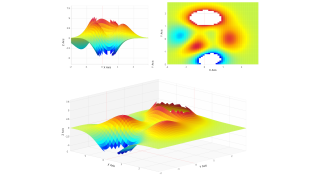
Demonstrates creating multiple views of 3D data with transparent sections.