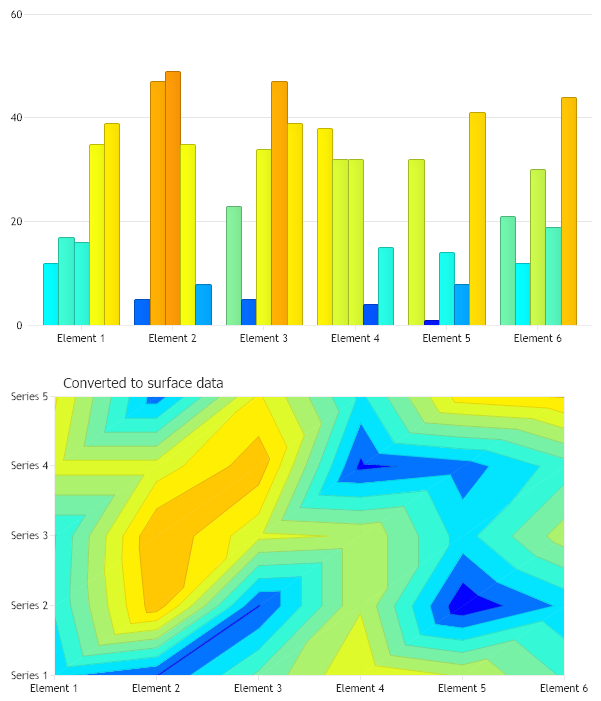
Surface From Category Data
Demonstrates how to draw a surface chart from category based series where elements use names for x axis values.
<%@ Page Language="C#" Description="dotnetCHARTING Component" %>
<%@ Register TagPrefix="dnc" Namespace="dotnetCHARTING" Assembly="dotnetCHARTING" %>
<%@ Import Namespace="System.Drawing" %>
<%@ Import Namespace="System.Drawing.Drawing2D" %>
<%@ Import Namespace="dotnetCHARTING.Mapping" %>
<%@ Import Namespace="System.Collections.Generic" %>
<script runat="server">
void Page_Load(Object sender, EventArgs e)
{
// Demonstrates how to draw a surface chart from category based series where elements use names for x axis values.
Chart.Size = "600x350";
Chart.TempDirectory = "temp";
Chart.Debug = true;
Chart.LegendBox.Visible = false;
Chart.SmartPalette = SmartPalette.FromColorsRange(ElementValue.YValue, new ScaleRange(0, 60), Color.Blue, Color.Aqua, Color.LightGreen, Color.Yellow, Color.Orange, Color.Crimson);
// *DYNAMIC DATA NOTE*
// This sample uses random data to populate the chart. To populate
// a chart with database data see the following resources:
// - Use the getLiveData() method using the dataEngine to query a database.
// - Help File > Getting Started > Data Tutorials
// - DataEngine Class in the help file
// - Sample: features/DataEngine.aspx
SeriesCollection mySC = getRandomData();
// Add the random data.
Chart.SeriesCollection.Add(mySC);
// Setup the surface chart.
Chart1.Size = "600x350";
Chart1.Title = "Converted to surface data";
Chart1.TempDirectory = "temp";
Chart1.Type = ChartType.Surface;
Chart1.LegendBox.Visible = false;
Chart1.DefaultSeries.ContourCount = 10;
Chart1.DefaultSeries.Type = SeriesTypeSurface.Contour;
// Get a surface series from the random data
List<string> xLabels,yLabels;
Series surfaceSeries = mySC.GetSurfaceData(out xLabels, out yLabels);
Chart1.SeriesCollection.Add(surfaceSeries);
Chart1.XAxis.ClearValues = true;
Chart1.YAxis.ClearValues = true;
for (int i = 0; i < xLabels.Count; i++)
Chart1.XAxis.ExtraTicks.Add(new AxisTick(i, xLabels[i]));
for (int i = 0; i < yLabels.Count; i++)
Chart1.YAxis.ExtraTicks.Add(new AxisTick(i, yLabels[i]));
// Make a smartPalette for the value range.
Chart1.SmartPalette = SmartPalette.FromColorsRange(ElementValue.ZValue, new ScaleRange(0, 60), Color.Blue, Color.Aqua, Color.LightGreen, Color.Yellow, Color.Orange, Color.Crimson);
}
SeriesCollection getRandomData()
{
Random myR = new Random(1);
SeriesCollection SC = new SeriesCollection();
for (int a = 1; a < 6; a++)
{
Series s = new Series("Series " + a.ToString());
for (int b = 1; b < 7; b++)
{
Element e = new Element("Element " + b.ToString());
e.YValue = myR.Next(50);
s.Elements.Add(e);
}
SC.Add(s);
}
return SC;
}
SeriesCollection getLiveData()
{
DataEngine de = new DataEngine(ConfigurationManager.AppSettings["DNCConnectionString"]);
de.ChartObject = Chart; // Necessary to view any errors the dataEngine may throw.
de.SqlStatement = "SELECT XAxisColumn, YAxisColumn FROM ....";
return de.GetSeries();
}
</script>
<html xmlns="http://www.w3.org/1999/xhtml">
<head>
<title>.netCHARTING Sample</title>
</head>
<style type="text/css">
div, p
{
font-family: Arial, Helvetica, sans-serif;
font-size: x-small;
}
</style>
<body>
<div align="center">
<dnc:Chart ID="Chart" runat="server" />
<dnc:Chart ID="Chart1" runat="server" />
</div>
</body>
</html>
<%@ Page Language="vb" Description="dotnetCHARTING Component" %>
<%@ Register TagPrefix="dnc" Namespace="dotnetCHARTING" Assembly="dotnetCHARTING" %>
<%@ Import Namespace="System.Drawing" %>
<%@ Import Namespace="System.Drawing.Drawing2D" %>
<%@ Import Namespace="dotnetCHARTING.Mapping" %>
<%@ Import Namespace="System.Collections.Generic" %>
<script runat="server">
Sub Page_Load(ByVal sender As Object, ByVal e As EventArgs)
' Demonstrates how to draw a surface chart from category based series where elements use names for x axis values.
Chart.Size = "600x350"
Chart.TempDirectory = "temp"
Chart.Debug = True
Chart.LegendBox.Visible = False
Chart.SmartPalette = SmartPalette.FromColorsRange(ElementValue.YValue, New ScaleRange(0, 60), Color.Blue, Color.Aqua, Color.LightGreen, Color.Yellow, Color.Orange, Color.Crimson)
' *DYNAMIC DATA NOTE*
' This sample uses random data to populate the chart. To populate
' a chart with database data see the following resources:
' - Use the getLiveData() method using the dataEngine to query a database.
' - Help File > Getting Started > Data Tutorials
' - DataEngine Class in the help file
' - Sample: features/DataEngine.aspx
Dim mySC As SeriesCollection = getRandomData()
' Add the random data.
Chart.SeriesCollection.Add(mySC)
' Setup the surface chart.
Chart1.Size = "600x350"
Chart1.Title = "Converted to surface data"
Chart1.TempDirectory = "temp"
Chart1.Type = ChartType.Surface
Chart1.LegendBox.Visible = False
Chart1.DefaultSeries.ContourCount = 10
Chart1.DefaultSeries.Type = SeriesTypeSurface.Contour
' Get a surface series from the random data
Dim xLabels As List(Of String), yLabels As List(Of String)
Dim surfaceSeries As Series = mySC.GetSurfaceData(xLabels, yLabels)
Chart1.SeriesCollection.Add(surfaceSeries)
Chart1.XAxis.ClearValues = True
Chart1.YAxis.ClearValues = True
For i As Integer = 0 To xLabels.Count - 1
Chart1.XAxis.ExtraTicks.Add(New AxisTick(i, xLabels(i)))
Next i
For i As Integer = 0 To yLabels.Count - 1
Chart1.YAxis.ExtraTicks.Add(New AxisTick(i, yLabels(i)))
Next i
' Make a smartPalette for the value range.
Chart1.SmartPalette = SmartPalette.FromColorsRange(ElementValue.ZValue, New ScaleRange(0, 60), Color.Blue, Color.Aqua, Color.LightGreen, Color.Yellow, Color.Orange, Color.Crimson)
End Sub
Function getRandomData() As SeriesCollection
Dim myR As Random = New Random(1)
Dim SC As SeriesCollection = New SeriesCollection()
For a As Integer = 1 To 5
Dim s As Series = New Series("Series " & a.ToString())
For b As Integer = 1 To 6
Dim e As Element = New Element("Element " & b.ToString())
e.YValue = myR.Next(50)
s.Elements.Add(e)
Next b
SC.Add(s)
Next a
Return SC
End Function
Function getLiveData() As SeriesCollection
Dim de As DataEngine = New DataEngine(ConfigurationManager.AppSettings("DNCConnectionString"))
de.ChartObject = Chart ' Necessary to view any errors the dataEngine may throw.
de.SqlStatement = "SELECT XAxisColumn, YAxisColumn FROM ...."
Return de.GetSeries()
End Function
</script>
<html xmlns="http://www.w3.org/1999/xhtml">
<head>
<title>.netCHARTING Sample</title>
</head>
<style type="text/css">
div, p
{
font-family: Arial, Helvetica, sans-serif;
font-size: x-small;
}
</style>
<body>
<div align="center">
<dnc:Chart ID="Chart" runat="server" />
<dnc:Chart ID="Chart1" runat="server" />
</div>
</body>
</html>