// Add the random data. c.SeriesCollection.Add(mySC); } SeriesCollection getRData() { int size = 50; double xMin = -2; double xSpacing = .1; double yMin = -2; double ySpacing = .1; double[][] zVals = new double[size][]; double[] xVals = new double[size]; double[] yVals = new double[size]; for (int i = 0; i < size; i++) { zVals[i] = new double[size]; for (int j = 0; j < size; j++) { double x = (double)(xMin + i * xSpacing); double y = (double)(yMin + j * ySpacing); xVals[i] = x; yVals[j] = y; zVals[i][j] = 3 * Math.Pow((1 - x), 2) * Math.Exp(-x * x - (y + 1) * (y + 1)) - 10 * (0.2 * x - Math.Pow(x, 3) - Math.Pow(y, 5)) * Math.Exp(-x * x - y * y) - 1 / 3 * Math.Exp(-(x + 1) * (x + 1) - y * y); } } SeriesCollection SC = new SeriesCollection(); Series s = Series.FromSurfaceData("", xVals, yVals, zVals); SC.Add(s); return SC; }
SeriesCollection getLiveData() { DataEngine de = new DataEngine(ConfigurationManager.AppSettings["DNCConnectionString"]); de.ChartObject = Chart; // Necessary to view any errors the dataEngine may throw. de.SqlStatement = "SELECT XAxisColumn, YAxisColumn FROM ...."; return de.GetSeries(); }
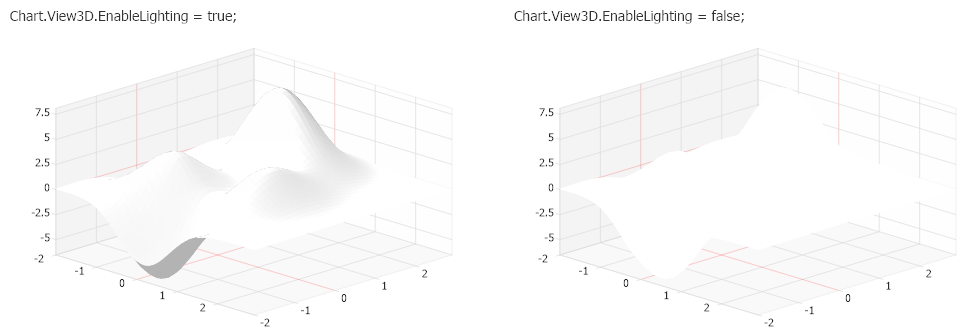
Sub Page_Load(ByVal sender As Object, ByVal e As EventArgs) ' Demonstrates the effect of Disabling 3D lighting.
SetChart_Renamed(Chart) SetChart_Renamed(Chart1) Chart1.View3D.EnableLighting = False Chart.Title = "Chart.View3D.EnableLighting = true;" Chart1.Title = "Chart.View3D.EnableLighting = false;" End Sub
Sub SetChart_Renamed(ByVal c As Chart) c.Size = "500x350" c.TempDirectory = "temp" c.Mentor = False c.Debug = True c.Use3D = True c.Type = ChartType.Surface c.View3D.AngleOfTilt = 30 c.DefaultSeries.Line.Transparency = 100 c.DefaultSeries.Background.Color = Color.White Dim mySC As SeriesCollection = getRData()
c.LegendBox.Visible = False
' Add the random data. c.SeriesCollection.Add(mySC) End Sub Function getRData() As SeriesCollection Dim size As Integer = 50 Dim xMin As Double = -2 Dim xSpacing As Double =.1 Dim yMin As Double = -2 Dim ySpacing As Double =.1 Dim zVals As Double()() = New Double(size - 1)(){} Dim xVals As Double() = New Double(size - 1){} Dim yVals As Double() = New Double(size - 1){} For i As Integer = 0 To size - 1 zVals(i) = New Double(size - 1){} For j As Integer = 0 To size - 1 Dim x As Double = CDbl(xMin + i * xSpacing) Dim y As Double = CDbl(yMin + j * ySpacing) xVals(i) = x yVals(j) = y zVals(i)(j) = 3 * Math.Pow((1 - x), 2) * Math.Exp(-x * x - (y + 1) * (y + 1)) - 10 * (0.2 * x - Math.Pow(x, 3) - Math.Pow(y, 5)) * Math.Exp(-x * x - y * y) - 1 / 3 * Math.Exp(-(x + 1) * (x + 1) - y * y) Next j Next i Dim SC As SeriesCollection = New SeriesCollection() Dim s As Series = Series.FromSurfaceData("", xVals, yVals, zVals) SC.Add(s) Return SC End Function
Function getLiveData() As SeriesCollection Dim de As DataEngine = New DataEngine(ConfigurationManager.AppSettings("DNCConnectionString")) de.ChartObject = Chart ' Necessary to view any errors the dataEngine may throw. de.SqlStatement = "SELECT XAxisColumn, YAxisColumn FROM ...." Return de.GetSeries() End Function