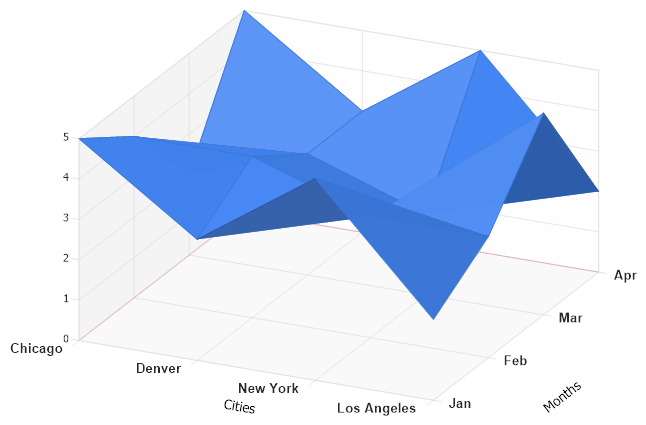
Surface Axis Labels
Demonstrates how labels can be used on axes with surface charts.
<%@ Page Language="C#" Description="dotnetCHARTING Component" %>
<%@ Register TagPrefix="dnc" Namespace="dotnetCHARTING" Assembly="dotnetCHARTING" %>
<%@ Import Namespace="System.Drawing" %>
<script runat="server">
void Page_Load(Object sender, EventArgs e)
{
// Demonstrates how labels can be used on axes with surface charts.
Chart.Size = "680x450";
//Chart.Title = ".netCHARTING Sample";
Chart.TempDirectory = "temp";
Chart.Debug = true;
Chart.Type = ChartType.Surface;
Chart.LegendBox.Visible = false;
Chart.View3D.AngleOfRotation = 25;
Chart.View3D.AngleOfTilt = 35;
Chart.Use3D = true;
Chart.YAxis.Label.Text = "Months";
Chart.XAxis.Label.Text = "Cities";
// Add the random data.
Chart.SeriesCollection.Add(getRData());
Chart.DefaultAxis.DefaultTick.Line.Length = 8;
Chart.DefaultAxis.Interval = 1;
Chart.XAxis.DefaultTick.Label.Font = new Font("Arial", 10, FontStyle.Bold);
Chart.YAxis.DefaultTick.Label.Font = new Font("Arial", 10, FontStyle.Bold);
// Disable any axis ticks that are generated automatically.
Chart.XAxis.ClearValues = true;
Chart.YAxis.ClearValues = true;
// Replace values on axis with text labels
for (int i = 0; i < xAxisLabels.Length; i++)
{
Chart.XAxis.ExtraTicks.Add(new AxisTick(i, xAxisLabels[i]));
Chart.YAxis.ExtraTicks.Add(new AxisTick(i, yAxisLabels[i]));
}
}
string[] xAxisLabels = new string[] { "Chicago", "Denver", "New York", "Los Angeles" };
string[] yAxisLabels = new string[] { "Jan", "Feb", "Mar", "Apr" };
SeriesCollection getRData()
{
double[][] zVals = new double[4][];
double[] yVals = new double[] { 0, 1, 2, 3 };
double[] xVals = new double[] { 0, 1, 2, 3 };
zVals[0] = new double[] { 5, 4, 2, 5 };
zVals[1] = new double[] { 3, 4, 3, 3 };
zVals[2] = new double[] { 5, 3, 2, 5 };
zVals[3] = new double[] { 2, 3, 5, 2 };
return new SeriesCollection(Series.FromSurfaceData("", xVals, yVals, zVals));
}
</script>
<html xmlns="http://www.w3.org/1999/xhtml">
<head>
<title>.netCHARTING Sample</title>
</head>
<style type="text/css">
div, p
{
font-family: Arial, Helvetica, sans-serif;
font-size: x-small;
}
</style>
<body>
<div align="center">
<dnc:Chart ID="Chart" runat="server" />
</div>
</body>
</html>
<%@ Page Language="vb" Description="dotnetCHARTING Component" %>
<%@ Register TagPrefix="dnc" Namespace="dotnetCHARTING" Assembly="dotnetCHARTING" %>
<%@ Import Namespace="System.Drawing" %>
<script runat="server">
Sub Page_Load(ByVal sender As Object, ByVal e As EventArgs)
' Demonstrates how labels can be used on axes with surface charts.
Chart.Size = "680x450"
'Chart.Title = ".netCHARTING Sample";
Chart.TempDirectory = "temp"
Chart.Debug = True
Chart.Type = ChartType.Surface
Chart.LegendBox.Visible = False
Chart.View3D.AngleOfRotation = 25
Chart.View3D.AngleOfTilt = 35
Chart.Use3D = True
Chart.YAxis.Label.Text = "Months"
Chart.XAxis.Label.Text = "Cities"
' Add the random data.
Chart.SeriesCollection.Add(getRData())
Chart.DefaultAxis.DefaultTick.Line.Length = 8
Chart.DefaultAxis.Interval = 1
Chart.XAxis.DefaultTick.Label.Font = New Font("Arial", 10, FontStyle.Bold)
Chart.YAxis.DefaultTick.Label.Font = New Font("Arial", 10, FontStyle.Bold)
' Disable any axis ticks that are generated automatically.
Chart.XAxis.ClearValues = True
Chart.YAxis.ClearValues = True
' Replace values on axis with text labels
For i As Integer = 0 To xAxisLabels.Length - 1
Chart.XAxis.ExtraTicks.Add(New AxisTick(i, xAxisLabels(i)))
Chart.YAxis.ExtraTicks.Add(New AxisTick(i, yAxisLabels(i)))
Next i
End Sub
Dim xAxisLabels As String() = New String() { "Chicago", "Denver", "New York", "Los Angeles" }
Dim yAxisLabels As String() = New String() { "Jan", "Feb", "Mar", "Apr" }
Function getRData() As SeriesCollection
Dim zVals As Double()() = New Double(3)(){}
Dim yVals As Double() = New Double() { 0, 1, 2, 3 }
Dim xVals As Double() = New Double() { 0, 1, 2, 3 }
zVals(0) = New Double() { 5, 4, 2, 5 }
zVals(1) = New Double() { 3, 4, 3, 3 }
zVals(2) = New Double() { 5, 3, 2, 5 }
zVals(3) = New Double() { 2, 3, 5, 2 }
Return New SeriesCollection(Series.FromSurfaceData("", xVals, yVals, zVals))
End Function
</script>
<html xmlns="http://www.w3.org/1999/xhtml">
<head>
<title>.netCHARTING Sample</title>
</head>
<style type="text/css">
div, p
{
font-family: Arial, Helvetica, sans-serif;
font-size: x-small;
}
</style>
<body>
<div align="center">
<dnc:Chart ID="Chart" runat="server" />
</div>
</body>
</html>