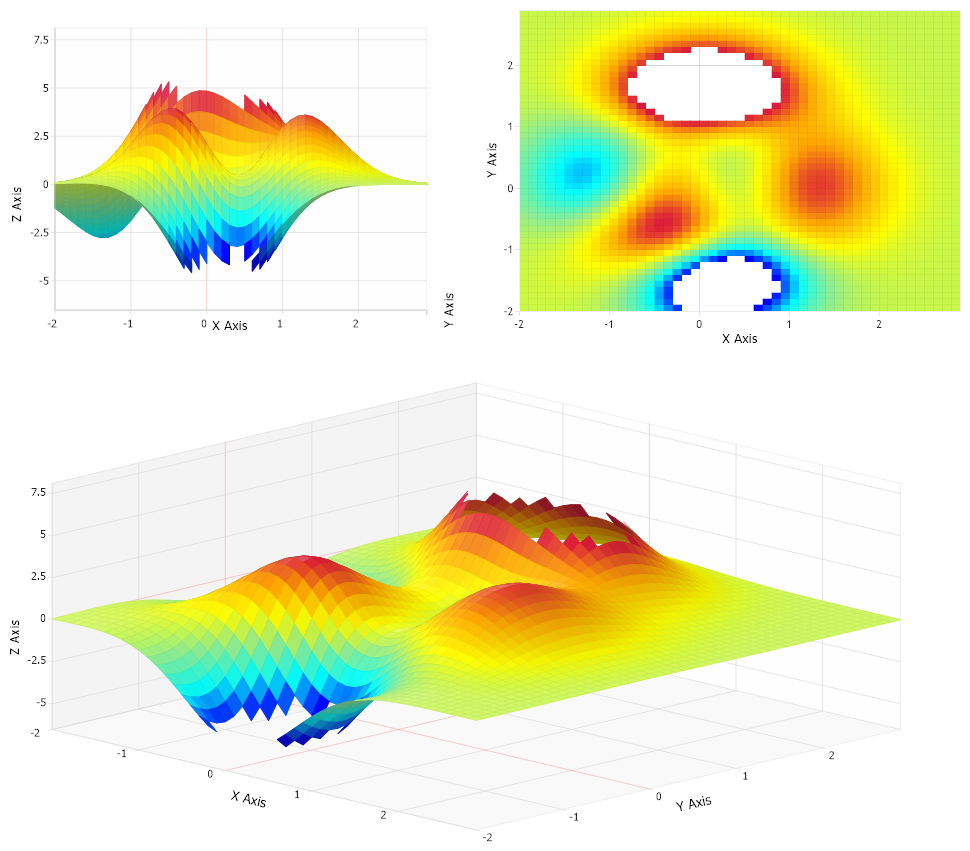
Surface Views Transparent
Demonstrates creating multiple views of 3D data with transparent sections.
<%@ Page Language="C#" Description="dotnetCHARTING Component" %>
<%@ Register TagPrefix="dnc" Namespace="dotnetCHARTING" Assembly="dotnetCHARTING" %>
<%@ Import Namespace="System.Drawing" %>
<%@ Import Namespace="System.Drawing.Drawing2D" %>
<%@ Import Namespace="dotnetCHARTING.Mapping" %>
<script runat="server">
void Page_Load(Object sender, EventArgs e)
{
// Demonstrates creating multiple views of 3D data with transparent sections.
SetChart(Chart);
SetChart(Chart1);
SetChart(Chart2);
Chart.View3D.AngleOfRotation = 0;
Chart.View3D.AngleOfTilt = 0;
Chart1.Use3D = false;
Chart2.Size = "1000x500";
Chart.YAxis.ClearValues = true;
}
void SetChart(Chart c)
{
c.Size = "500x350";
c.TempDirectory = "temp";
c.Debug = true;
c.Use3D = true;
c.Mentor = false;
c.Type = ChartType.Surface;
c.View3D.AngleOfTilt = 30;
c.LegendBox.Visible = false;
c.Palette = new Color[] { Color.Blue, Color.Aqua, Color.LightGreen, Color.Yellow, Color.Orange, Color.Crimson };
c.XAxis.Label.Text = "X Axis";
c.YAxis.Label.Text = "Y Axis";
c.ZAxis.Label.Text = "Z Axis";
c.DefaultSeries.Line.Transparency = 70;
SeriesCollection mySC = getRData();
c.SmartPalette = SmartPalette.FromColorsRange(ElementValue.ZValue, new ScaleRange(-4, 4), c.Palette);
// Add the random data.
c.SeriesCollection.Add(mySC);
}
SeriesCollection getRData()
{
int size = 50;
double[][] zVals = new double[size][];
double[] xVals = new double[size];
double[] yVals = new double[size];
for (int i = 0; i < size; i++)
{
zVals[i] = new double[size];
for (int j = 0; j < size; j++)
{
double x = (double)(-2 + i * .1);
double y = (double)(-2 + j * .1);
xVals[i] = x;
yVals[j] = y;
zVals[i][j] = 3 * Math.Pow((1 - x), 2) * Math.Exp(-x * x -
(y + 1) * (y + 1)) - 10 * (0.2 * x - Math.Pow(x, 3) -
Math.Pow(y, 5)) * Math.Exp(-x * x - y * y) -
1 / 3 * Math.Exp(-(x + 1) * (x + 1) - y * y);
}
}
return new SeriesCollection(Series.FromSurfaceData("", xVals, yVals, zVals));
}
</script>
<html xmlns="http://www.w3.org/1999/xhtml">
<head>
<title>.netCHARTING Sample</title>
</head>
<style type="text/css">
div, p
{
font-family: Arial, Helvetica, sans-serif;
font-size: x-small;
}
</style>
<body>
<div align="center">
<table>
<tr>
<td>
<dnc:Chart ID="Chart" runat="server" />
</td>
<td>
<dnc:Chart ID="Chart1" runat="server" />
</td>
</tr>
<tr>
<td colspan="2">
<dnc:Chart ID="Chart2" runat="server" />
</td>
</tr>
</table>
</div>
</body>
</html>
<%@ Page Language="vb" Description="dotnetCHARTING Component" %>
<%@ Register TagPrefix="dnc" Namespace="dotnetCHARTING" Assembly="dotnetCHARTING" %>
<%@ Import Namespace="System.Drawing" %>
<%@ Import Namespace="System.Drawing.Drawing2D" %>
<%@ Import Namespace="dotnetCHARTING.Mapping" %>
<script runat="server">
Sub Page_Load(ByVal sender As Object, ByVal e As EventArgs)
' Demonstrates creating multiple views of 3D data with transparent sections.
SetChart_Renamed(Chart)
SetChart_Renamed(Chart1)
SetChart_Renamed(Chart2)
Chart.View3D.AngleOfRotation = 0
Chart.View3D.AngleOfTilt = 0
Chart1.Use3D = False
Chart2.Size = "1000x500"
Chart.YAxis.ClearValues = True
End Sub
Sub SetChart_Renamed(ByVal c As Chart)
c.Size = "500x350"
c.TempDirectory = "temp"
c.Debug = True
c.Use3D = True
c.Mentor = False
c.Type = ChartType.Surface
c.View3D.AngleOfTilt = 30
c.LegendBox.Visible = False
c.Palette = New Color() { Color.Blue, Color.Aqua, Color.LightGreen, Color.Yellow, Color.Orange, Color.Crimson }
c.XAxis.Label.Text = "X Axis"
c.YAxis.Label.Text = "Y Axis"
c.ZAxis.Label.Text = "Z Axis"
c.DefaultSeries.Line.Transparency = 70
Dim mySC As SeriesCollection = getRData()
c.SmartPalette = SmartPalette.FromColorsRange(ElementValue.ZValue, New ScaleRange(-4, 4), c.Palette)
' Add the random data.
c.SeriesCollection.Add(mySC)
End Sub
Function getRData() As SeriesCollection
Dim size As Integer = 50
Dim zVals As Double()() = New Double(size - 1)(){}
Dim xVals As Double() = New Double(size - 1){}
Dim yVals As Double() = New Double(size - 1){}
For i As Integer = 0 To size - 1
zVals(i) = New Double(size - 1){}
For j As Integer = 0 To size - 1
Dim x As Double = CDbl(-2 + i *.1)
Dim y As Double = CDbl(-2 + j *.1)
xVals(i) = x
yVals(j) = y
zVals(i)(j) = 3 * Math.Pow((1 - x), 2) * Math.Exp(-x * x - (y + 1) * (y + 1)) - 10 * (0.2 * x - Math.Pow(x, 3) - Math.Pow(y, 5)) * Math.Exp(-x * x - y * y) - 1 / 3 * Math.Exp(-(x + 1) * (x + 1) - y * y)
Next j
Next i
Return New SeriesCollection(Series.FromSurfaceData("", xVals, yVals, zVals))
End Function
</script>
<html xmlns="http://www.w3.org/1999/xhtml">
<head>
<title>.netCHARTING Sample</title>
</head>
<style type="text/css">
div, p
{
font-family: Arial, Helvetica, sans-serif;
font-size: x-small;
}
</style>
<body>
<div align="center">
<table>
<tr>
<td>
<dnc:Chart ID="Chart" runat="server" />
</td>
<td>
<dnc:Chart ID="Chart1" runat="server" />
</td>
</tr>
<tr>
<td colspan="2">
<dnc:Chart ID="Chart2" runat="server" />
</td>
</tr>
</table>
</div>
</body>
</html>