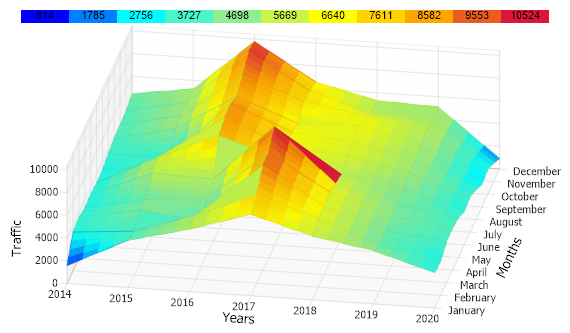
Surface Time DB
Demonstrates how normal chart data can be converted into surface data.
<%@ Page Language="C#" Description="dotnetCHARTING Component" %>
<%@ Register TagPrefix="dnc" Namespace="dotnetCHARTING" Assembly="dotnetCHARTING" %>
<%@ Import Namespace="System.Drawing" %>
<%@ Import Namespace="System.Drawing.Drawing2D" %>
<%@ Import Namespace="dotnetCHARTING.Mapping" %>
<%@ Import Namespace="System.Collections.Generic" %>
<script runat="server">
void Page_Load(Object sender, EventArgs e)
{
// Demonstrates how normal chart data can be converted into surface data.
Chart.Size = "650x350";
Chart.Use3D = true;
Chart.Type = ChartType.Surface;
Chart.ShowDateInTitle = false;
Chart.TempDirectory = "temp";
Chart.Debug = true;
Chart.Palette = new Color[] { Color.Blue, Color.Aqua, Color.LightGreen, Color.Yellow, Color.Orange, Color.Crimson };
Chart.View3D.AngleOfRotation = 10;
Chart.View3D.AngleOfTilt = 50;
Chart.DefaultSeries.InterpolationFillFactor = 4;
Chart.DefaultSeries.Line.Transparency = 60;
Chart.DefaultAxis.DefaultTick.Line.Length = 7;
Chart.LegendBox.Visible = false;
Chart.MarginTop = 10;
Chart.XAxis.Label.Text = "Years";
Chart.YAxis.Label.Text = "Months";
Chart.ZAxis.Label.Text = "Traffic";
Chart.XAxis.ClearValues = true;
Chart.YAxis.ClearValues = true;
// Get data first.
SeriesCollection mySC = getLiveData();
Chart.SeriesCollection.Add(setupChartForSurface(Chart, mySC));
Chart.SmartPalette = Chart.SeriesCollection[0].GetSmartPalette(ElementValue.ZValue, Chart.Palette);
// A swatch can then be generated based on the smartPalette.
Annotation an = new Annotation(getSwatch(450, Chart.SmartPalette, 10, true));
an.ClearColors();
an.Position = new Point(45, 0);
an.DynamicSize = false;
Chart.Annotations.Add(an);
}
SeriesCollection getLiveData()
{
DataEngine de = new DataEngine(ConfigurationManager.AppSettings["DNCConnectionString"]);
de.ChartObject = Chart; // Necessary to view any errors the dataEngine may throw.
de.SqlStatement = "SELECT dDate,downloads FROM downloads ";
de.DateGrouping = TimeInterval.Months;
SeriesCollection sc = de.GetSeries();
return sc;
}
Series setupChartForSurface(Chart c, SeriesCollection mySC)
{
List<DateTime> xDates;
Series se = mySC[0].GetSurfaceData(TimeIntervalAdvanced.Years, out xDates);
for (int i = 0; i < xDates.Count; i++)
Chart.XAxis.ExtraTicks.Add(new AxisTick(i, xDates[i].Year.ToString()));
for (int i = 0; i < 12; i++)
c.YAxis.ExtraTicks.Add(new AxisTick(i, new DateTime(2020, i + 1, 1).ToString("MMMM")));
return se;
}
string getSwatch(int width, SmartPalette sp, int divisions, bool withValues)
{
// Get Maximum Value of the smart palette range
double max = (double)sp.GetScaleRange("*").ValueHigh;
double min = (double)sp.GetScaleRange("*").ValueLow;
string swatch = "", spacers = "";
double step = (max - min) / divisions;
// Width of each division.
int boxWidth = width / divisions;
// Generate swatch string for each division.
for (int i = 0; i <= divisions; i++)
{
spacers += "<Chart:Spacer size='" + boxWidth + "x1'>";
// Get the color of the current division.
string color = getHTMLColor(sp.GetValueColor("", min + (i * (step))));
if (withValues)
swatch += "<block hAlignment='Center' bgColor='" + color + "'>" + Math.Round((min + (i * (step))), 0);
else
swatch += "<block bgColor='" + color + "' fColor='" + color + "'>_";
}
//return the swatch string.
return spacers + "<row>" + swatch;
}
string getHTMLColor(Color c)
{
return "#" + c.R.ToString("X2") + c.G.ToString("X2") + c.B.ToString("X2");
}
</script>
<html xmlns="http://www.w3.org/1999/xhtml">
<head>
<title>.netCHARTING Sample</title>
</head>
<style type="text/css">
div, p
{
font-family: Arial, Helvetica, sans-serif;
font-size: x-small;
}
</style>
<body>
<div align="center">
<dnc:Chart ID="Chart" runat="server" />
</div>
</body>
</html>
<%@ Page Language="vb" Description="dotnetCHARTING Component" %>
<%@ Register TagPrefix="dnc" Namespace="dotnetCHARTING" Assembly="dotnetCHARTING" %>
<%@ Import Namespace="System.Drawing" %>
<%@ Import Namespace="System.Drawing.Drawing2D" %>
<%@ Import Namespace="dotnetCHARTING.Mapping" %>
<%@ Import Namespace="System.Collections.Generic" %>
<script runat="server">
Sub Page_Load(ByVal sender As Object, ByVal e As EventArgs)
' Demonstrates how normal chart data can be converted into surface data.
Chart.Size = "650x350"
Chart.Use3D = True
Chart.Type = ChartType.Surface
Chart.ShowDateInTitle = False
Chart.TempDirectory = "temp"
Chart.Debug = True
Chart.Palette = New Color() { Color.Blue, Color.Aqua, Color.LightGreen, Color.Yellow, Color.Orange, Color.Crimson }
Chart.View3D.AngleOfRotation = 10
Chart.View3D.AngleOfTilt = 50
Chart.DefaultSeries.InterpolationFillFactor = 4
Chart.DefaultSeries.Line.Transparency = 60
Chart.DefaultAxis.DefaultTick.Line.Length = 7
Chart.LegendBox.Visible = False
Chart.MarginTop = 10
Chart.XAxis.Label.Text = "Years"
Chart.YAxis.Label.Text = "Months"
Chart.ZAxis.Label.Text = "Traffic"
Chart.XAxis.ClearValues = True
Chart.YAxis.ClearValues = True
' Get data first.
Dim mySC As SeriesCollection = getLiveData()
Chart.SeriesCollection.Add(setupChartForSurface(Chart, mySC))
Chart.SmartPalette = Chart.SeriesCollection(0).GetSmartPalette(ElementValue.ZValue, Chart.Palette)
' A swatch can then be generated based on the smartPalette.
Dim an As Annotation = New Annotation(getSwatch(450, Chart.SmartPalette, 10, True))
an.ClearColors()
an.Position = New Point(45, 0)
an.DynamicSize = False
Chart.Annotations.Add(an)
End Sub
Function getLiveData() As SeriesCollection
Dim de As DataEngine = New DataEngine(ConfigurationManager.AppSettings("DNCConnectionString"))
de.ChartObject = Chart ' Necessary to view any errors the dataEngine may throw.
de.SqlStatement = "SELECT dDate,downloads FROM downloads "
de.DateGrouping = TimeInterval.Months
Dim sc As SeriesCollection = de.GetSeries()
Return sc
End Function
Function setupChartForSurface(ByVal c As Chart, ByVal mySC As SeriesCollection) As Series
Dim xDates As List(Of DateTime)
Dim se As Series = mySC(0).GetSurfaceData(TimeIntervalAdvanced.Years, xDates)
For i As Integer = 0 To xDates.Count - 1
Chart.XAxis.ExtraTicks.Add(New AxisTick(i, xDates(i).Year.ToString()))
Next i
For i As Integer = 0 To 11
c.YAxis.ExtraTicks.Add(New AxisTick(i, New DateTime(2020, i + 1, 1).ToString("MMMM")))
Next i
Return se
End Function
Function getSwatch(ByVal width As Integer, ByVal sp As SmartPalette, ByVal divisions As Integer, ByVal withValues As Boolean) As String
' Get Maximum Value of the smart palette range
Dim max As Double = CDbl(sp.GetScaleRange("*").ValueHigh)
Dim min As Double = CDbl(sp.GetScaleRange("*").ValueLow)
Dim swatch As String = "", spacers As String = ""
Dim [step] As Double = (max - min) / divisions
' Width of each division.
Dim boxWidth As Integer = width / divisions
' Generate swatch string for each division.
For i As Integer = 0 To divisions
spacers &= "<Chart:Spacer size='" & boxWidth & "x1'>"
' Get the color of the current division.
Dim color As String = getHTMLColor(sp.GetValueColor("", min + (i * ([step]))))
If withValues Then
swatch &= "<block hAlignment='Center' bgColor='" & color & "'>" & Math.Round((min + (i * ([step]))), 0)
Else
swatch &= "<block bgColor='" & color & "' fColor='" & color & "'>_"
End If
Next i
'return the swatch string.
Return spacers & "<row>" & swatch
End Function
Function getHTMLColor(ByVal c As Color) As String
Return "#" & c.R.ToString("X2") + c.G.ToString("X2") + c.B.ToString("X2")
End Function
</script>
<html xmlns="http://www.w3.org/1999/xhtml">
<head>
<title>.netCHARTING Sample</title>
</head>
<style type="text/css">
div, p
{
font-family: Arial, Helvetica, sans-serif;
font-size: x-small;
}
</style>
<body>
<div align="center">
<dnc:Chart ID="Chart" runat="server" />
</div>
</body>
</html>