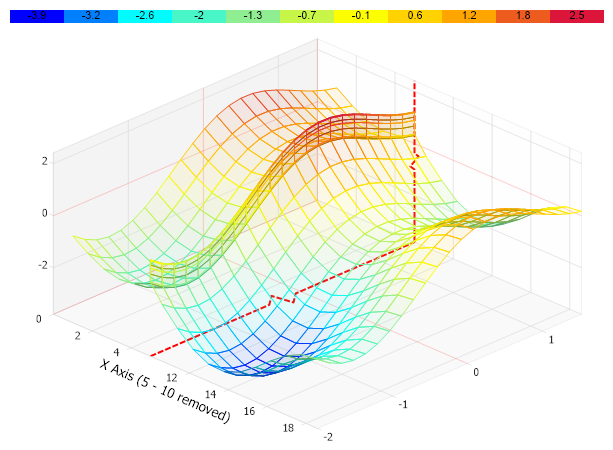
Surface Axis Scale Break
Demonstrates using scale breaks on surface charts.
<%@ Page Language="C#" Description="dotnetCHARTING Component" %>
<%@ Register TagPrefix="dnc" Namespace="dotnetCHARTING" Assembly="dotnetCHARTING" %>
<%@ Import Namespace="System.Drawing" %>
<%@ Import Namespace="System.Drawing.Drawing2D" %>
<%@ Import Namespace="dotnetCHARTING.Mapping" %>
<script runat="server">
void Page_Load(Object sender, EventArgs e)
{
// Demonstrates using scale breaks on surface charts.
Chart.Size = "650x450";
Chart.TempDirectory = "temp";
Chart.Debug = true;
Chart.Use3D = true;
Chart.Type = ChartType.Surface;
Chart.LegendBox.Visible = false;
Chart.DefaultSeries.Background.Transparency = 90;
Chart.DefaultSeries.Type = SeriesTypeSurface.Surface;
Chart.MarginTop = 30;
Chart.XAxis.ScaleBreaks.Add(new ScaleRange(5, 10));
Chart.XAxis.Interval = 2;
Chart.XAxis.Label.Text = "X Axis (5 - 10 removed)";
Chart.XAxis.ScaleBreakLine = new Line(Color.Red,2, DashStyle.Dash);
SeriesCollection mySC = getRData();
Chart.SmartPalette = mySC[0].GetSmartPalette(ElementValue.ZValue, Color.Blue, Color.Aqua, Color.LightGreen, Color.Yellow, Color.Orange, Color.Crimson);
Annotation an = new Annotation(getSwatch(510, Chart.SmartPalette, 10, true));
an.ClearColors();
an.Position = new Point(15, 0);
an.DynamicSize = false;
Chart.Annotations.Add(an);
// Add the random data.
Chart.SeriesCollection.Add(mySC);
}
SeriesCollection getRData()
{
int size = 23;
double[][] zVals = new double[size][];
double[] xVals = new double[size];
double[] yVals = new double[size];
for (int i = 0; i < size; i++)
{
zVals[i] = new double[size];
for (int j = 0; j < size; j++)
{
double x = (double)(0 + i * .16);
double y = (double)(-2 + j * .16);
xVals[i] = 1 + x++ * 5;
yVals[j] = y;
zVals[i][j] = Math.Sin(x * 3.2) + Math.Cos(y * 2) + Math.Sin(x * 1.2) + Math.Sin(y * 1.2);
}
}
return new SeriesCollection(Series.FromSurfaceData("", xVals, yVals, zVals));
}
string getSwatch(int width, SmartPalette sp, int divisions, bool withValues)
{
// Get Maximum Value of the smart palette range
double max = (double)sp.GetScaleRange("*").ValueHigh;
double min = (double)sp.GetScaleRange("*").ValueLow;
string swatch = "", spacers = "";
double step = (max - min) / divisions;
// Width of each division.
int boxWidth = width / divisions;
// Generate swatch string for each division.
for (int i = 0; i <= divisions; i++)
{
spacers += "<Chart:Spacer size='" + boxWidth + "x1'>";
// Get the color of the current division.
string color = getHTMLColor(sp.GetValueColor("", min + (i * (step))));
if (withValues)
swatch += "<block hAlignment='Center' bgColor='" + color + "'>" + Math.Round((min + (i * (step))), 1);
else
swatch += "<block bgColor='" + color + "' fColor='" + color + "'>_";
}
//return the swatch string.
return spacers + "<row>" + swatch;
}
string getHTMLColor(Color c)
{
return "#" + c.R.ToString("X2") + c.G.ToString("X2") + c.B.ToString("X2");
}
</script>
<html xmlns="http://www.w3.org/1999/xhtml">
<head>
<title>.netCHARTING Sample</title>
</head>
<style type="text/css">
div, p
{
font-family: Arial, Helvetica, sans-serif;
font-size: x-small;
}
</style>
<body>
<form id="form1" runat="server">
<div align="center">
<dnc:Chart ID="Chart" runat="server" />
</div>
</form>
</body>
</html>
<%@ Page Language="vb" Description="dotnetCHARTING Component" %>
<%@ Register TagPrefix="dnc" Namespace="dotnetCHARTING" Assembly="dotnetCHARTING" %>
<%@ Import Namespace="System.Drawing" %>
<%@ Import Namespace="System.Drawing.Drawing2D" %>
<script runat="server">
Sub Page_Load(ByVal sender As Object, ByVal e As EventArgs)
' Demonstrates using scale breaks on surface charts.
Chart.Size = "650x450"
Chart.TempDirectory = "temp"
Chart.Debug = True
Chart.Use3D = True
Chart.Type = ChartType.Surface
Chart.LegendBox.Visible = False
Chart.DefaultSeries.Background.Transparency = 90
Chart.DefaultSeries.Type = SeriesTypeSurface.Surface
Chart.MarginTop = 30
Chart.XAxis.ScaleBreaks.Add(New ScaleRange(5, 10))
Chart.XAxis.Interval = 2
Chart.XAxis.Label.Text = "X Axis (5 - 10 removed)"
Chart.XAxis.ScaleBreakLine = New Line(Color.Red,2, DashStyle.Dash)
Dim mySC As SeriesCollection = getRData()
Chart.SmartPalette = mySC(0).GetSmartPalette(ElementValue.ZValue, Color.Blue, Color.Aqua, Color.LightGreen, Color.Yellow, Color.Orange, Color.Crimson)
Dim an As Annotation = New Annotation(getSwatch(510, Chart.SmartPalette, 10, True))
an.ClearColors()
an.Position = New Point(15, 0)
an.DynamicSize = False
Chart.Annotations.Add(an)
' Add the random data.
Chart.SeriesCollection.Add(mySC)
End Sub
Function getRData() As SeriesCollection
Dim size As Integer = 23
Dim zVals As Double()() = New Double(size - 1)(){}
Dim xVals As Double() = New Double(size - 1){}
Dim yVals As Double() = New Double(size - 1){}
For i As Integer = 0 To size - 1
zVals(i) = New Double(size - 1){}
For j As Integer = 0 To size - 1
Dim x As Double = CDbl(0 + i *.16)
Dim y As Double = CDbl(-2 + j *.16)
xVals(i) = 1 + x * 5
x = x + 1
yVals(j) = y
zVals(i)(j) = Math.Sin(x * 3.2) + Math.Cos(y * 2) + Math.Sin(x * 1.2) + Math.Sin(y * 1.2)
Next j
Next i
Return New SeriesCollection(Series.FromSurfaceData("", xVals, yVals, zVals))
End Function
Function getSwatch(ByVal width As Integer, ByVal sp As SmartPalette, ByVal divisions As Integer, ByVal withValues As Boolean) As String
' Get Maximum Value of the smart palette range
Dim max As Double = CDbl(sp.GetScaleRange("*").ValueHigh)
Dim min As Double = CDbl(sp.GetScaleRange("*").ValueLow)
Dim swatch As String = "", spacers As String = ""
Dim [step] As Double = (max - min) / divisions
' Width of each division.
Dim boxWidth As Integer = width / divisions
' Generate swatch string for each division.
For i As Integer = 0 To divisions
spacers &= "<Chart:Spacer size='" & boxWidth & "x1'>"
' Get the color of the current division.
Dim color As String = getHTMLColor(sp.GetValueColor("", min + (i * ([step]))))
If withValues Then
swatch &= "<block hAlignment='Center' bgColor='" & color & "'>" & Math.Round((min + (i * ([step]))), 1)
Else
swatch &= "<block bgColor='" & color & "' fColor='" & color & "'>_"
End If
Next i
'return the swatch string.
Return spacers & "<row>" & swatch
End Function
Function getHTMLColor(ByVal c As Color) As String
Return "#" & c.R.ToString("X2") + c.G.ToString("X2") + c.B.ToString("X2")
End Function
</script>
<html xmlns="http://www.w3.org/1999/xhtml">
<head>
<title>.netCHARTING Sample</title>
</head>
<style type="text/css">
div, p
{
font-family: Arial, Helvetica, sans-serif;
font-size: x-small;
}
</style>
<body>
<form id="form1" runat="server">
<div align="center">
<dnc:Chart ID="Chart" runat="server" />
</div>
</form>
</body>
</html>