Gallery
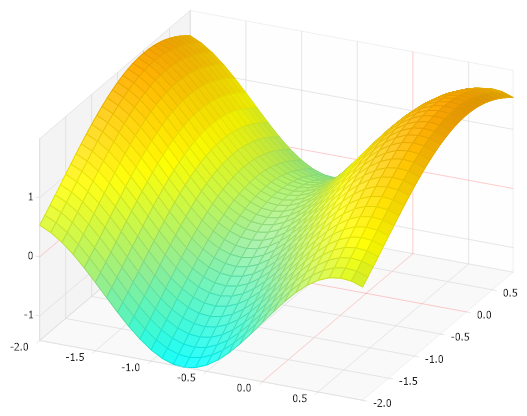
Surface From Elements
<%@ Page Language="C#" Description="dotnetCHARTING Component" %>
<%@ Register TagPrefix="dnc" Namespace="dotnetCHARTING" Assembly="dotnetCHARTING" %>
<%@ Import Namespace="System.Drawing" %>
<%@ Import Namespace="System.Drawing.Drawing2D" %>
<%@ Import Namespace="dotnetCHARTING.Mapping" %>
<script runat="server">
void Page_Load(Object sender, EventArgs e)
{
// Demonstrates how to populate a surface chart by creating elements.
// Please note that if your chart uses a large amount of data, this approach
// entails more overhead and may be slower than using arrays.
Chart.Size = "600x450";
Chart.TempDirectory = "temp";
Chart.Debug = true;
Chart.Type = ChartType.Surface;
Chart.LegendBox.Visible = false;
Chart.View3D.AngleOfRotation = 25;
Chart.View3D.AngleOfTilt = 35;
Chart.Use3D = true;
SeriesCollection mySC = getRData();
// Add the random data.
Chart.SeriesCollection.Add(mySC);
// Create a smart palette based on data.
Chart.SmartPalette = mySC[0].GetSmartPalette(ElementValue.ZValue, Color.Aqua, Color.LightGreen, Color.Yellow, Color.Orange);
}
SeriesCollection getRData()
{
int size = 30;
Series s = new Series();
for (int i = 0; i < size; i++)
{
for (int j = 0; j < size; j++)
{
Element e = new Element();
e.XValue = (double)(-2 + i * .1);
e.YValue = (double)(-2 + j * .1);
e.ZValue = Math.Sin(e.XValue * 2.2) + Math.Cos(e.YValue);
s.Elements.Add(e);
}
}
SeriesCollection SC = new SeriesCollection();
SC.Add(s);
return SC;
}
</script>
<html xmlns="http://www.w3.org/1999/xhtml">
<head>
<title>.netCHARTING Sample</title>
</head>
<style type="text/css">
div, p
{
font-family: Arial, Helvetica, sans-serif;
font-size: x-small;
}
</style>
<body>
<div align="center">
<dnc:Chart ID="Chart" runat="server" />
</div>
</body>
</html>
<%@ Page Language="vb" Description="dotnetCHARTING Component" %>
<%@ Register TagPrefix="dnc" Namespace="dotnetCHARTING" Assembly="dotnetCHARTING" %>
<%@ Import Namespace="System.Drawing" %>
<%@ Import Namespace="System.Drawing.Drawing2D" %>
<%@ Import Namespace="dotnetCHARTING.Mapping" %>
<script runat="server">
Sub Page_Load(ByVal sender As Object, ByVal e As EventArgs)
' Demonstrates how to populate a surface chart by creating elements.
' Please note that if your chart uses a large amount of data, this approach
' entails more overhead and may be slower than using arrays.
Chart.Size = "600x450"
Chart.TempDirectory = "temp"
Chart.Debug = True
Chart.Type = ChartType.Surface
Chart.LegendBox.Visible = False
Chart.View3D.AngleOfRotation = 25
Chart.View3D.AngleOfTilt = 35
Chart.Use3D = True
Dim mySC As SeriesCollection = getRData()
' Add the random data.
Chart.SeriesCollection.Add(mySC)
' Create a smart palette based on data.
Chart.SmartPalette = mySC(0).GetSmartPalette(ElementValue.ZValue, Color.Aqua, Color.LightGreen, Color.Yellow, Color.Orange)
End Sub
Function getRData() As SeriesCollection
Dim size As Integer = 30
Dim s As Series = New Series()
For i As Integer = 0 To size - 1
For j As Integer = 0 To size - 1
Dim e As Element = New Element()
e.XValue = CDbl(-2 + i *.1)
e.YValue = CDbl(-2 + j *.1)
e.ZValue = Math.Sin(e.XValue * 2.2) + Math.Cos(e.YValue)
s.Elements.Add(e)
Next j
Next i
Dim SC As SeriesCollection = New SeriesCollection()
SC.Add(s)
Return SC
End Function
</script>
<html xmlns="http://www.w3.org/1999/xhtml">
<head>
<title>.netCHARTING Sample</title>
</head>
<style type="text/css">
div, p
{
font-family: Arial, Helvetica, sans-serif;
font-size: x-small;
}
</style>
<body>
<div align="center">
<dnc:Chart ID="Chart" runat="server" />
</div>
</body>
</html>
- Sample FilenameSurfaceFromElements.aspx
- Version6.2
- Uses DatabaseNo