<script runat="server"> void Page_Load(Object sender,EventArgs e) { // Demonstrates series can be sorted. Chart.TempDirectory = "temp"; Chart.Debug = true; Chart.Use3D = true; Chart.DefaultSeries.DefaultElement.Transparency = 20; Chart.DefaultSeries.Type=SeriesType.AreaLine; Chart.Title = "Sorting Series By Name in ascending order";
//First we generate our data, if you would like to get the data from a database you need to use // the data engine. See sample: features/dataEngine.aspx. Or the dataEngine tutorial in the help file. SeriesCollection mySC = getData();
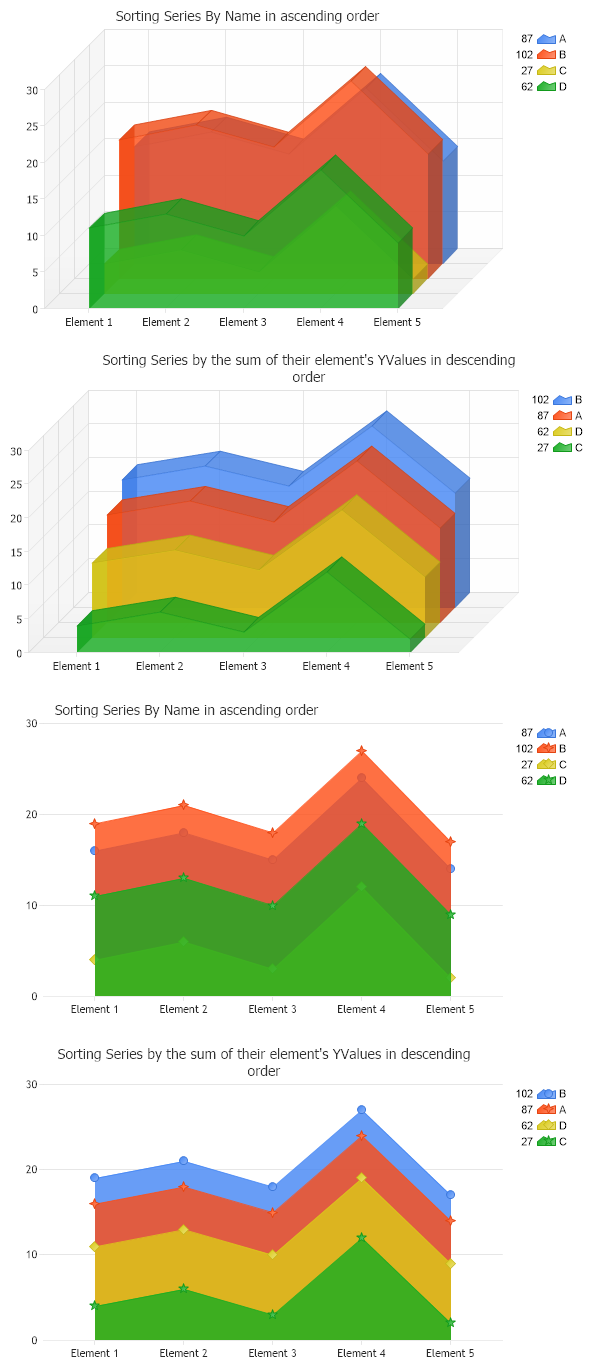
//First sort it by name and add it to the first chart. mySC.Sort(ElementValue.Name,"ASC"); Chart.SeriesCollection.Add(mySC);
//Next chart Chart1.TempDirectory = "temp"; Chart1.Width=600; Chart1.Debug = true; Chart1.Use3D = true; Chart1.DefaultSeries.DefaultElement.Transparency = 20; Chart1.DefaultSeries.Type=SeriesType.AreaLine; SeriesCollection mySC1 = getData(); // Then sort the series by y value. The y value for each series is the sum of all element y values within the series. mySC1.Sort(ElementValue.YValue,"DESC"); Chart1.SeriesCollection.Add(mySC1); Chart1.Title = "Sorting Series by the sum of their element's YValues in descending order";
Chart2.TempDirectory = "temp"; Chart2.Debug = true; Chart2.Use3D = false; Chart2.DefaultSeries.DefaultElement.Transparency = 20; Chart2.DefaultSeries.Type=SeriesType.AreaLine; Chart2.Title = "Sorting Series By Name in ascending order";
SeriesCollection mySC2 = getData(); //sort it by name and add it to the chart. mySC2.Sort(ElementValue.Name,"ASC"); Chart2.SeriesCollection.Add(mySC2); Chart2.Title = "Sorting Series By Name in ascending order"; Chart2.DefaultSeries.Type=SeriesType.AreaLine;
Chart3.TempDirectory = "temp"; Chart3.Debug = true; Chart3.Use3D = false; Chart3.DefaultSeries.DefaultElement.Transparency = 20; Chart3.DefaultSeries.Type=SeriesType.AreaLine; // Then lest sort the series by y value. The y value for each series is the sum of all element y values within the series. SeriesCollection mySC3 = getData(); mySC3.Sort(ElementValue.YValue,"DESC"); Chart3.SeriesCollection.Add(mySC3); Chart3.Title = "Sorting Series by the sum of their element's YValues in descending order";
}
SeriesCollection getData() { SeriesCollection SC = new SeriesCollection(); Random myR = new Random(); for(int a = 1; a < 5; a++) { Series s = new Series(); s.Name = "Series " + a; Element e = new Element(); e.Name = "Element 1"; e.YValue = 20-(a*a); s.Elements.Add(e);
e = new Element(); e.Name = "Element 2"; e.YValue = 22-(a*a); s.Elements.Add(e);
e = new Element(); e.Name = "Element 3"; e.YValue = 19-(a*a); s.Elements.Add(e);
e = new Element(); e.Name = "Element 4"; e.YValue = 28-(a*a); s.Elements.Add(e);
e = new Element(); e.Name = "Element 5"; e.YValue = 18-(a*a); s.Elements.Add(e);
<script runat="server"> Sub Page_Load(ByVal sender As Object, ByVal e As EventArgs) ' Demonstrates series can be sorted. Chart.TempDirectory = "temp" Chart.Debug = True Chart.Use3D = True Chart.DefaultSeries.DefaultElement.Transparency = 20 Chart.DefaultSeries.Type=SeriesType.AreaLine Chart.Title = "Sorting Series By Name in ascending order"
'First we generate our data, if you would like to get the data from a database you need to use ' the data engine. See sample: features/dataEngine.aspx. Or the dataEngine tutorial in the help file. Dim mySC As SeriesCollection = getData()
'First sort it by name and add it to the first chart. mySC.Sort(ElementValue.Name,"ASC") Chart.SeriesCollection.Add(mySC)
'Next chart Chart1.TempDirectory = "temp" Chart1.Width=600 Chart1.Debug = True Chart1.Use3D = True Chart1.DefaultSeries.DefaultElement.Transparency = 20 Chart1.DefaultSeries.Type=SeriesType.AreaLine Dim mySC1 As SeriesCollection = getData() ' Then sort the series by y value. The y value for each series is the sum of all element y values within the series. mySC1.Sort(ElementValue.YValue,"DESC") Chart1.SeriesCollection.Add(mySC1) Chart1.Title = "Sorting Series by the sum of their element's YValues in descending order"
Chart2.TempDirectory = "temp" Chart2.Debug = True Chart2.Use3D = False Chart2.DefaultSeries.DefaultElement.Transparency = 20 Chart2.DefaultSeries.Type=SeriesType.AreaLine Chart2.Title = "Sorting Series By Name in ascending order"
Dim mySC2 As SeriesCollection = getData() 'sort it by name and add it to the chart. mySC2.Sort(ElementValue.Name,"ASC") Chart2.SeriesCollection.Add(mySC2) Chart2.Title = "Sorting Series By Name in ascending order" Chart2.DefaultSeries.Type=SeriesType.AreaLine
Chart3.TempDirectory = "temp" Chart3.Debug = True Chart3.Use3D = False Chart3.DefaultSeries.DefaultElement.Transparency = 20 Chart3.DefaultSeries.Type=SeriesType.AreaLine ' Then lest sort the series by y value. The y value for each series is the sum of all element y values within the series. Dim mySC3 As SeriesCollection = getData() mySC3.Sort(ElementValue.YValue,"DESC") Chart3.SeriesCollection.Add(mySC3) Chart3.Title = "Sorting Series by the sum of their element's YValues in descending order"
End Sub
Function getData() As SeriesCollection Dim SC As SeriesCollection = New SeriesCollection() Dim myR As Random = New Random() For a As Integer = 1 To 4 Dim s As Series = New Series() s.Name = "Series " & a Dim e As Element = New Element() e.Name = "Element 1" e.YValue = 20-(a*a) s.Elements.Add(e)
e = New Element() e.Name = "Element 2" e.YValue = 22-(a*a) s.Elements.Add(e)
e = New Element() e.Name = "Element 3" e.YValue = 19-(a*a) s.Elements.Add(e)
e = New Element() e.Name = "Element 4" e.YValue = 28-(a*a) s.Elements.Add(e)
e = New Element() e.Name = "Element 5" e.YValue = 18-(a*a) s.Elements.Add(e)
SC.Add(s)
Next a SC(0).Name="B" SC(1).Name="A" SC(2).Name="D" SC(3).Name="C"