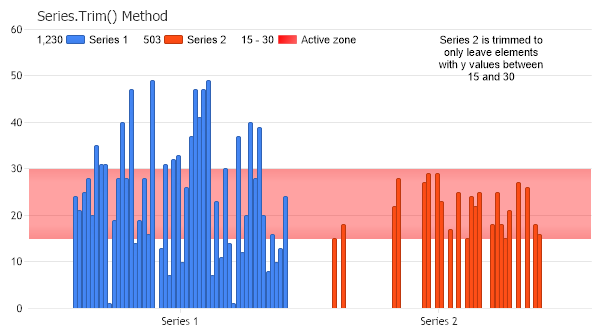
Chart.Type = ChartType.ComboSideBySide;//Horizontal; Chart.Width = 600; Chart.Height = 350; Chart.TempDirectory = "temp"; Chart.Debug = true; Chart.Title = "Series.Trim() Method"; Chart.LegendBox.Position = LegendBoxPosition.ChartArea; Annotation a = new Annotation(); a.Position = new Point(430,42); a.ClearColors(); a.Label.Text = "Series 2 is trimmed to only leave elements with y values between 15 and 30"; Chart.Annotations.Add(a);
// Demonstrates how to trim elements from a series.
// First we get our data, if you would like to get the data from a database you need to use // the data engine. See sample: features/dataEngine.aspx. Or the dataEngine tutorial in the help file. SeriesCollection mySC = getRandomData();
// mySC is a series collection that contains two series
// The first series will be shown in it's entirety. // The second is trimmed to only leave elements with y values between 20 and 30 mySC[1].Trim(15,30,ElementValue.YValue);
// Add a marker to the y axis to show the range of vales not trimmed from the second series. AxisMarker M=new AxisMarker(); M.LegendEntry.Name = "Active zone"; M.Background = new Background(Color.FromArgb(100,Color.Red)); M.ValueHigh = 30; M.ValueLow = 15; Chart.YAxis.Markers.Add(M);
// Add the random data. Chart.SeriesCollection.Add(mySC);
}
SeriesCollection getRandomData() { SeriesCollection SC = new SeriesCollection(); Random myR = new Random(); for(int a = 1; a < 3; a++) { Series s = new Series(); s.Name = "Series " + a; for(int b = 1; b < 51; b++) { Element e = new Element(); e.Name = "Element " + b; e.YValue = myR.Next(50); s.Elements.Add(e); } SC.Add(s); }
<%@ Page Language="vb" Description="dotnetCHARTING Component" %> <%@ Register TagPrefix="dotnet" Namespace="dotnetCHARTING" Assembly="dotnetCHARTING"%> <%@ Import Namespace="System.Drawing" %> <html xmlns="http://www.w3.org/1999/xhtml"> <head> <title>.netCHARTING Sample</title> <script runat="server"> Sub Page_Load(ByVal sender As Object, ByVal e As EventArgs)
Chart.Type = ChartType.ComboSideBySide 'Horizontal; Chart.Width = 600 Chart.Height = 350 Chart.TempDirectory = "temp" Chart.Debug = True Chart.Title = "Series.Trim() Method" Chart.LegendBox.Position = LegendBoxPosition.ChartArea Dim a As Annotation = New Annotation() a.Position = New Point(430,42) a.ClearColors() a.Label.Text = "Series 2 is trimmed to only leave elements with y values between 15 and 30" Chart.Annotations.Add(a)
' Demonstrates how to trim elements from a series.
' First we get our data, if you would like to get the data from a database you need to use ' the data engine. See sample: features/dataEngine.aspx. Or the dataEngine tutorial in the help file. Dim mySC As SeriesCollection = getRandomData()
' mySC is a series collection that contains two series
' The first series will be shown in it's entirety. ' The second is trimmed to only leave elements with y values between 20 and 30 mySC(1).Trim(15,30,ElementValue.YValue)
' Add a marker to the y axis to show the range of vales not trimmed from the second series. Dim M As AxisMarker = New AxisMarker() M.LegendEntry.Name = "Active zone" M.Background = New Background(Color.FromArgb(100,Color.Red)) M.ValueHigh = 30 M.ValueLow = 15 Chart.YAxis.Markers.Add(M)
' Add the random data. Chart.SeriesCollection.Add(mySC)
End Sub
Function getRandomData() As SeriesCollection Dim SC As SeriesCollection = New SeriesCollection() Dim myR As Random = New Random() For a As Integer = 1 To 2 Dim s As Series = New Series() s.Name = "Series " & a For b As Integer = 1 To 50 Dim e As Element = New Element() e.Name = "Element " & b e.YValue = myR.Next(50) s.Elements.Add(e) Next b SC.Add(s) Next a
Return SC End Function </script> </head> <body> <div style="text-align:center"> <dotnet:Chart id="Chart" runat="server" Width="568px" Height="344px"> </dotnet:Chart> </div> </body> </html>