Gallery
<%@ Page Language="C#" Description="dotnetCHARTING Component" %>
<%@ Register TagPrefix="dotnet" Namespace="dotnetCHARTING" Assembly="dotnetCHARTING"%>
<%@ Import Namespace="System.Drawing" %>
<%@ Import Namespace="System.Drawing.Drawing2D" %>
<script runat="server">
void Page_Load(Object sender,EventArgs e)
{
Chart.Type = ChartType.Combo;//Horizontal;
Chart.Size = "600x350";
Chart.TempDirectory = "temp";
Chart.Debug = true;
//Chart.Title = ".netCHARTING Gallery Sample";
Chart.DefaultSeries.Type = SeriesType.Line;
Chart.TitleBox.Position = TitleBoxPosition.FullWithLegend;
Chart.DefaultElement.Marker.Visible = false;
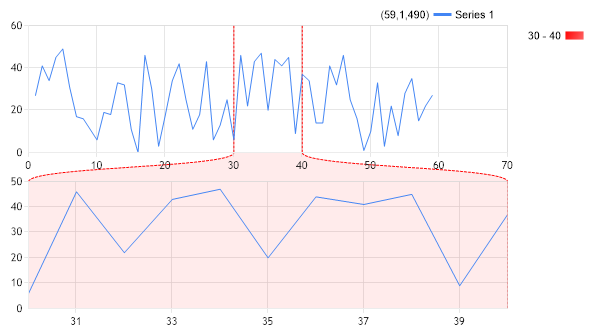
// Zooming the x axis.
ChartArea zoomArea = Chart.ChartArea.GetXZoomChartArea(Chart.XAxis, new ScaleRange(30, 40),new Line(Color.Red,DashStyle.Dash));
Chart.ExtraChartAreas.Add(zoomArea);
// *DYNAMIC DATA NOTE*
// This sample uses random data to populate the chart. To populate
// a chart with database data see the following resources:
// - Classic samples folder
// - Help File > Data Tutorials
// - Sample: features/DataEngine.aspx
SeriesCollection mySC = getRandomData();
// Add the random data.
Chart.SeriesCollection.Add(mySC);
}
SeriesCollection getRandomData()
{
SeriesCollection SC = new SeriesCollection();
Random myR = new Random();
for(int a = 1; a < 2; a++)
{
Series s = new Series();
s.Name = "Series " + a.ToString();
for(int b = 1; b < 60; b++)
{
Element e = new Element();
e.YValue = myR.Next(50);
e.XValue = b+(5*(a-1));
s.Elements.Add(e);
}
SC.Add(s);
}
return SC;
}
</script>
<html xmlns="http://www.w3.org/1999/xhtml"><head><title>Gallery Sample</title></head>
<body>
<div style="text-align:center">
<dotnet:Chart id="Chart" runat="server"/>
</div>
</body>
</html>
<%@ Page Language="vb" Description="dotnetCHARTING Component" %>
<%@ Register TagPrefix="dotnet" Namespace="dotnetCHARTING" Assembly="dotnetCHARTING"%>
<%@ Import Namespace="System.Drawing" %>
<%@ Import Namespace="System.Drawing.Drawing2D" %>
<script runat="server">
Sub Page_Load(ByVal sender As Object, ByVal e As EventArgs)
Chart.Type = ChartType.Combo 'Horizontal;
Chart.Size = "600x350"
Chart.TempDirectory = "temp"
Chart.Debug = True
'Chart.Title = ".netCHARTING Gallery Sample";
Chart.DefaultSeries.Type = SeriesType.Line
Chart.TitleBox.Position = TitleBoxPosition.FullWithLegend
Chart.DefaultElement.Marker.Visible = False
' Zooming the x axis.
Dim zoomArea As ChartArea = Chart.ChartArea.GetXZoomChartArea(Chart.XAxis, New ScaleRange(30, 40),New Line(Color.Red,DashStyle.Dash))
Chart.ExtraChartAreas.Add(zoomArea)
' *DYNAMIC DATA NOTE*
' This sample uses random data to populate the chart. To populate
' a chart with database data see the following resources:
' - Classic samples folder
' - Help File > Data Tutorials
' - Sample: features/DataEngine.aspx
Dim mySC As SeriesCollection = getRandomData()
' Add the random data.
Chart.SeriesCollection.Add(mySC)
End Sub
Function getRandomData() As SeriesCollection
Dim SC As SeriesCollection = New SeriesCollection()
Dim myR As Random = New Random()
For a As Integer = 1 To 1
Dim s As Series = New Series()
s.Name = "Series " & a.ToString()
For b As Integer = 1 To 59
Dim e As Element = New Element()
e.YValue = myR.Next(50)
e.XValue = b+(5*(a-1))
s.Elements.Add(e)
Next b
SC.Add(s)
Next a
Return SC
End Function
</script>
<html xmlns="http://www.w3.org/1999/xhtml"><head><title>Gallery Sample</title></head>
<body>
<div style="text-align:center">
<dotnet:Chart id="Chart" runat="server"/>
</div>
</body>
</html>
- Sample FilenameGallery/a64.aspx
- Version4.0
- Uses DatabaseNo