Gallery
<%@ Page Language="C#" Description="dotnetCHARTING Component" %>
<%@ Register TagPrefix="dotnet" Namespace="dotnetCHARTING" Assembly="dotnetCHARTING"%>
<%@ Import Namespace="System.Drawing" %>
<script runat="server">
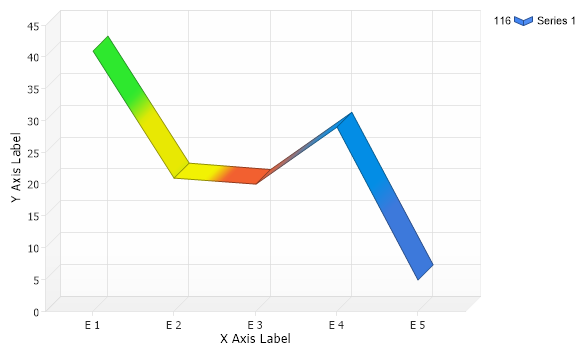
SeriesCollection getRandomData()
{
SeriesCollection SC = new SeriesCollection();
Random myR = new Random();
for(int a = 1; a < 2; a++)
{
Series s = new Series();
s.Name = "Series " + a;
for(int b = 1; b < 6; b++)
{
Element e = new Element();
e.Name = "E " + b;
e.YValue = 20 + myR.Next(30) - b*3;
s.Elements.Add(e);
}
SC.Add(s);
}
SC[0].Elements[0].Color = Color.FromArgb(49,255,49);
SC[0].Elements[1].Color = Color.FromArgb(255,255,0);
SC[0].Elements[2].Color = Color.FromArgb(255,99,49);
SC[0].Elements[3].Color = Color.FromArgb(0,156,255);
return SC;
}
void Page_Load(Object sender,EventArgs e)
{
// Set the title.
//Chart.Title="My Chart";
// Set 3D mode
Chart.Use3D = true;
// Specify the default series type.
Chart.DefaultSeries.Type = SeriesType.Line;
// Set the x axis label
Chart.XAxis.Label.Text="X Axis Label";
// Set the y axis label
Chart.YAxis.Label.Text="Y Axis Label";
// Set the directory where the images will be stored.
Chart.TempDirectory="temp";
// Set the bar shading effect
Chart.ShadingEffect = true;
// Set he chart size.
Chart.Width = 600;
Chart.Height = 350;
// Add the random data.
Chart.SeriesCollection.Add(getRandomData());
}
</script>
<html xmlns="http://www.w3.org/1999/xhtml"><head><title>Gallery Sample</title></head>
<body>
<div style="text-align:center">
<dotnet:Chart id="Chart" runat="server"/>
</div>
</body>
</html>
<%@ Page Language="vb" Description="dotnetCHARTING Component" %>
<%@ Register TagPrefix="dotnet" Namespace="dotnetCHARTING" Assembly="dotnetCHARTING"%>
<%@ Import Namespace="System.Drawing" %>
<script runat="server">
Function getRandomData() As SeriesCollection
Dim SC As SeriesCollection = New SeriesCollection()
Dim myR As Random = New Random()
For a As Integer = 1 To 1
Dim s As Series = New Series()
s.Name = "Series " & a
For b As Integer = 1 To 5
Dim e As Element = New Element()
e.Name = "E " & b
e.YValue = 20 + myR.Next(30) - b*3
s.Elements.Add(e)
Next b
SC.Add(s)
Next a
SC(0).Elements(0).Color = Color.FromArgb(49,255,49)
SC(0).Elements(1).Color = Color.FromArgb(255,255,0)
SC(0).Elements(2).Color = Color.FromArgb(255,99,49)
SC(0).Elements(3).Color = Color.FromArgb(0,156,255)
Return SC
End Function
Sub Page_Load(ByVal sender As Object, ByVal e As EventArgs)
' Set the title.
'Chart.Title="My Chart";
' Set 3D mode
Chart.Use3D = True
' Specify the default series type.
Chart.DefaultSeries.Type = SeriesType.Line
' Set the x axis label
Chart.XAxis.Label.Text="X Axis Label"
' Set the y axis label
Chart.YAxis.Label.Text="Y Axis Label"
' Set the directory where the images will be stored.
Chart.TempDirectory="temp"
' Set the bar shading effect
Chart.ShadingEffect = True
' Set he chart size.
Chart.Width = 600
Chart.Height = 350
' Add the random data.
Chart.SeriesCollection.Add(getRandomData())
End Sub
</script>
<html xmlns="http://www.w3.org/1999/xhtml"><head><title>Gallery Sample</title></head>
<body>
<div style="text-align:center">
<dotnet:Chart id="Chart" runat="server"/>
</div>
</body>
</html>
- Sample FilenameGallery/a391.aspx
- VersionLegacy (Pre 3.0)
- Uses DatabaseNo