Gallery
Iterate Elements
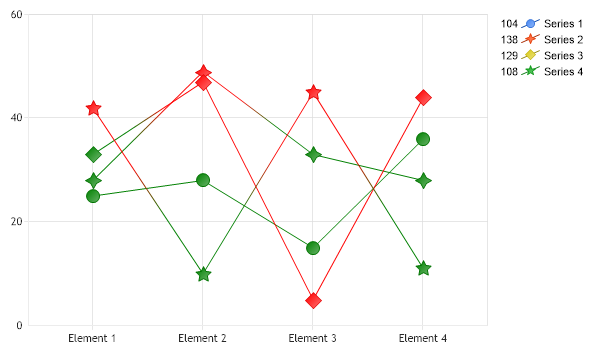
Demonstrates how you can iterate through elements and change their color.
- Sample FilenameIterateElements.aspx
- VersionLegacy (Pre 3.0)
- Uses DatabaseNo