Gallery
Operator Calculations
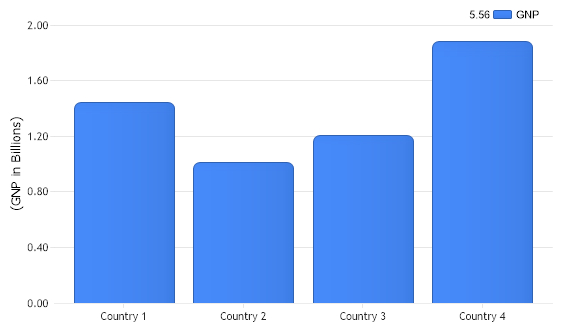
Demonstrates how operators can be used on series to manipulate chart data.
- Sample FilenameOperatorCalculations.aspx
- VersionLegacy (Pre 3.0)
- Uses DatabaseNo