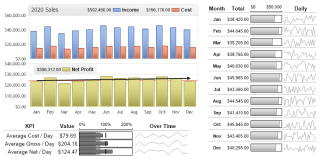
- JS Bullet Dashboard
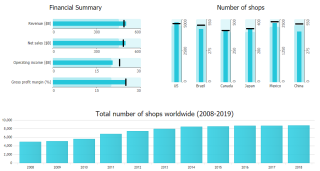
Demonstrates bullet micro charts with labels and axes.
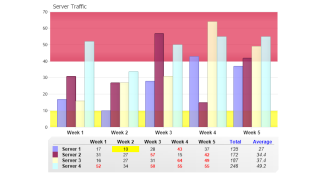
- JS House Sales Scatter
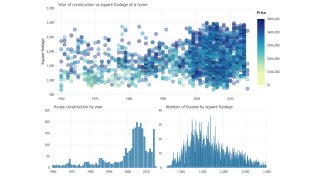
Demonstrates a scatter chart dashboard including column, and area charts.
- JS Calendar Sea Temps
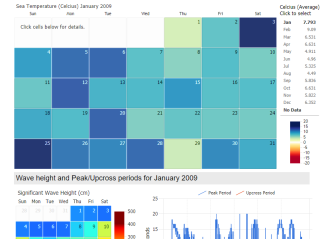
Demonstrates a calendar based dashboard using JavaScript charts.
- JS Weather Dashboard
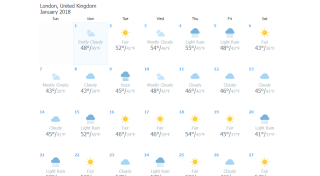
Demonstrates calendar with charts dashboard based on csv data.
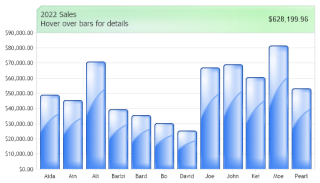
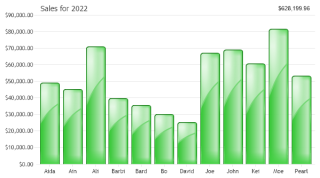
- JS Green
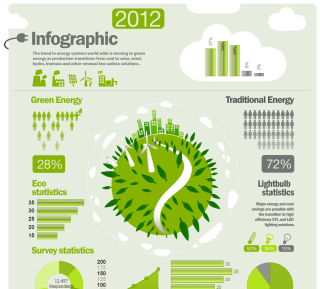
Demonstrates a dashboard with JS charts.
- JS Cooking
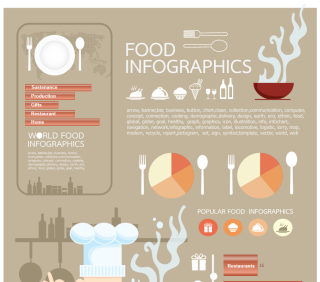
Demonstrates a dashboard with JS charts.
- JS Fitness
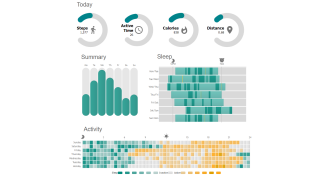
Demonstrates using a number of charts in a dashboard scneario.
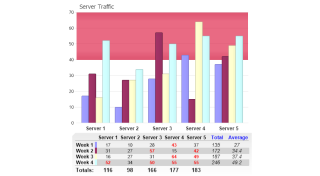
- Legend Info Grid
Demonstrates using an InfoGrid inside a legend box header.
- Legend Info Grid 2
Demonstrates using an InfoGrid inside a legend box header.
- Legend Info Grid 3
Demonstrates using an InfoGrid inside a legend box header.
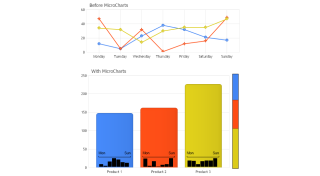
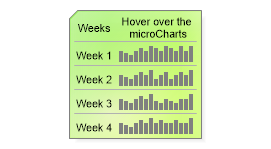
- Chart Micro Axis
Demonstrates using MicroCharts on axis tick labels to give more detail about the data.
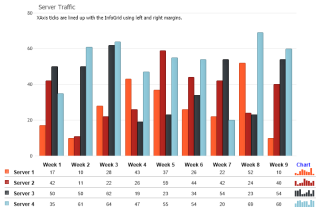
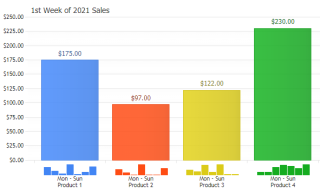
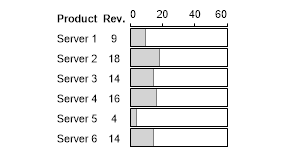
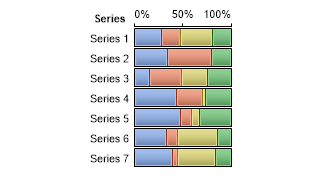
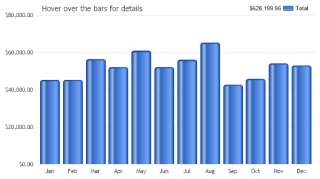
- Chart Micro Bar
Demonstrates using MicroCharts on bar labels and axis labels to represent data in a more readable manner.
- Chart Micro Pie
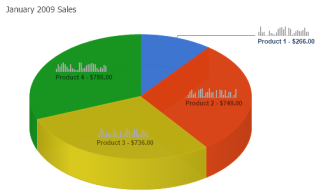
Demonstrates using MicroCharts as pie labels to give more detail about the data.
- Chart Micro Sub Values
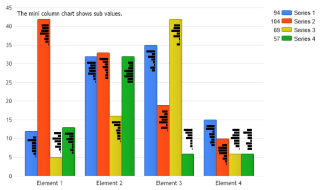
Demonstrates using MicroCharts to show element sub values in labels.
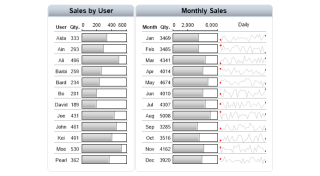
- Dashboard Matrix
Demonstrates a database driven digital dashboards utilizing a number of chart types.
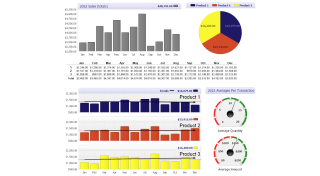
- Dashboard Matrix 2
Demonstrates a database driven digital dashboards utilizing a number of chart types including InfoGrids and MicroCharts.
- Data Grid Dash
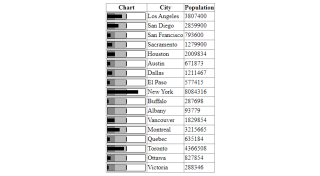
Demonstrates using MicroCharts inside DataGrids using a GetImage method.
- Data Grid Dash 2
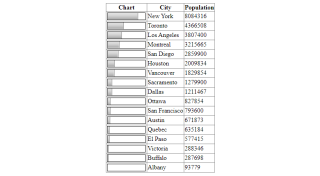
Demonstrates using MicroCharts inside DataGrids declaratively.
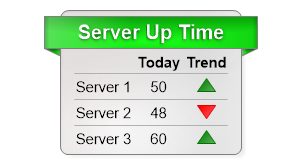
- Info Grid 1
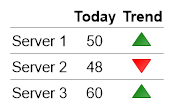
Demonstrates how to set up an infoGrid using MicroChart markers.
- Info Grid 2
Demonstrates how to set up an infoGrid using MicroCharts and data from a Series object.
- Info Grid 3
Demonstrates how to set up an infoGrid using MicroCharts and data from a Series object.
- Info Grid Multi
Demonstrates using multiple DB driven infoGrids inside annotations.
- Micro Chart Tool Tip DB Calculated
Demonstrates showing MicroChart tooltips based on SubValues created using the SeriesCollection.Calculate Method.
- Micro Chart Tooltip DB Calls
Demonstrates showing MicroChart tooltips based on SubValues created using nested Database calls.
- Micro Chart Tooltip DB Grouping
Demonstrates showing MicroChart tooltips based on SubValues created using the Series.SplitRegroupCalculate Method.
- Micro Chart Tooltips
Demonstrates microcharts with tooltips.
- Info Grid Ribbon
Demonstrates how to set up an infoGrid using MicroChart markers in a box with a ribbon.