Gallery
Chart Micro Sub Values
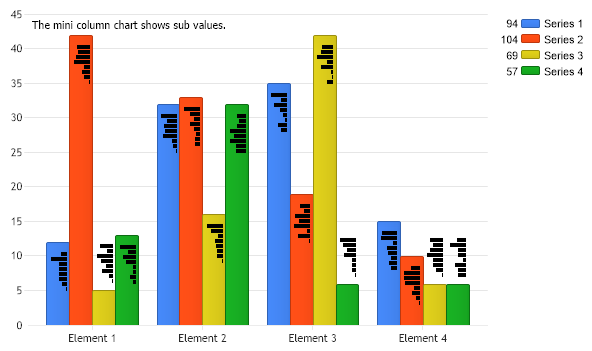
Demonstrates using MicroCharts to show element sub values in labels.
- Sample FilenameChartMicroSubValues.aspx
- Version5.2
- Uses DatabaseNo