Gallery
Chart Micro Pie
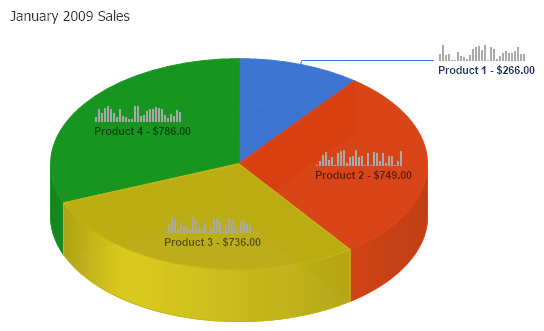
Demonstrates using MicroCharts as pie labels to give more detail about the data.
- Sample FilenameChartMicroPie.aspx
- Version5.2
- Uses DatabaseNo