Gallery
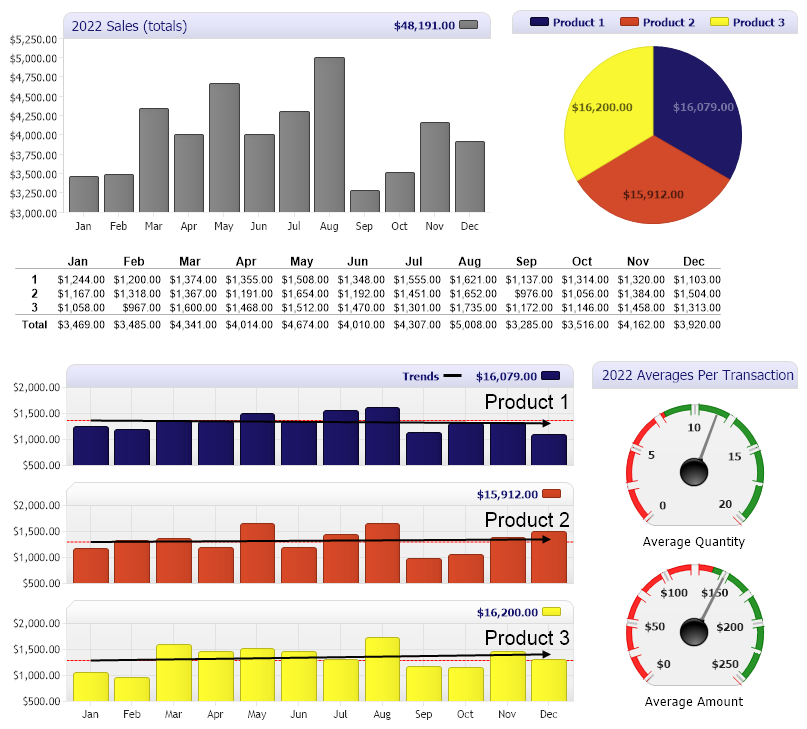
Dashboard Matrix
<%@ Page Language="C#" Description="dotnetCHARTING Component" %>
<%@ Register TagPrefix="dotnet" Namespace="dotnetCHARTING" Assembly="dotnetCHARTING" %>
<%@ Import Namespace="System.Drawing" %>
<%@ Import Namespace="System.Drawing.Drawing2D" %>
<script runat="server">
/// <summary>
/// Apply common settings for all charts.
/// </summary>
void setChart(Chart c)
{
c.TitleBox.Background.Color = Color.Lavender;
c.DefaultLegendBox.DefaultEntry.LabelStyle.Color = c.TitleBox.Label.Color = Color.MidnightBlue;
c.TitleBox.CornerTopLeft = BoxCorner.Round;
c.TitleBox.CornerTopRight = BoxCorner.Round;
c.DefaultLegendBox.DefaultEntry.LabelStyle.Font = new Font("Tahoma", 8, FontStyle.Bold);
//c.ShadingEffectMode = ShadingEffectMode.Two;
c.TitleBox.Position = TitleBoxPosition.FullWithLegend;
c.TempDirectory = "temp";
}
void Page_Load(Object sender, EventArgs e)
{
// Demonstrates a database driven digital dashboards utilizing a number of chart types.
// The chart layour is as follows:
// Chart Chart4
// Chart2
// Chart1 Chart3
// Apply common settings to each chart.
setChart(Chart);
setChart(Chart1);
setChart(Chart2);
setChart(Chart3);
setChart(Chart4);
// Set sizes for each individually.
Chart.Size = "500x240";
Chart4.Size = "300x240";
Chart2.Size = "800,100";
Chart3.Size = "220x380";
Chart1.Size = "580,380";
// ------- Chart setup
Chart.MarginTop = 1;
Chart.Palette = new Color[] { Color.Gray };
Chart.ChartArea.ClearColors();
Chart.ShowDateInTitle = false;
Chart.Title = "2022 Sales (totals)";
Chart.YAxis.Scale = Scale.Range;
Chart.YAxis.Line = new Line(Color.LightGray, 1);
Chart.DefaultFormatString = "Currency";
Chart.SeriesCollection.Add(getOrders());
// -------
// ------- Chart1 Setup
Chart1.MarginTop = 2;
Chart1.PaletteName = Palette.Bright;
Chart1.DefaultFormatString = "Currency";
Chart1.DefaultLegendBox.DefaultEntry.Name = "";
Chart1.DefaultAxis.DefaultTick.GridLine.Color = Color.Empty;
Chart1.DefaultAxis.AlternateGridBackground.Color = Color.Empty;
Chart1.DefaultAxis.TickNumberMaximum = 4;
Chart1.DefaultAxis.Scale = Scale.Range;
Chart1.DefaultChartArea.Background.Color = Color.FromArgb(240, 240, 240);
Chart1.DefaultChartArea.Label.Font = new Font("Arial", 15);
Chart1.DefaultChartArea.Label.Alignment = StringAlignment.Far;
Chart1.DefaultElement.Marker.Visible = false;
Chart1.LegendBox.Orientation = dotnetCHARTING.Orientation.Top;
// Add a legend entry to represent the trends.
Chart1.LegendBox.ExtraEntries.Add(new LegendEntry("", "Trends", Color.Black));
Chart1.LegendBox.ExtraEntries[0].SeriesType = SeriesType.Line;
Chart1.LegendBox.ExtraEntries[0].SortOrder = -1;
SeriesCollection mySCbp = getOrdersByProduct();
Chart1.SeriesCollection.Add(withTrend(mySCbp[0], "t0"));
ChartArea ca1 = new ChartArea(withTrend(mySCbp[1], "t1"));
ChartArea ca2 = new ChartArea(withTrend(mySCbp[2], "t2"));
Chart1.ChartArea.Label.Text = "Product 1";
ca1.Label.Text = "Product 2";
ca2.Label.Text = "Product 3";
ca1.TitleBox.Position = TitleBoxPosition.FullWithLegend;
ca2.TitleBox.Position = TitleBoxPosition.FullWithLegend;
ca1.TitleBox.CornerTopRight = BoxCorner.Round;
ca2.TitleBox.CornerTopRight = BoxCorner.Round;
Chart1.ExtraChartAreas.Add(ca1, ca2);
// -------
// ------- Chart 2 Setup
Chart2.ObjectChart = generateMarkup(getOrdersByProduct());
// -------
// ------- Chart 3 Setup
Chart3.Title = "2022 Averages Per Transaction";
Chart3.Palette = new Color[] { Color.Gray };
Chart3.LegendBox.Visible = false;
Chart3.TitleBox.Position = TitleBoxPosition.Full;
//Chart3.ShadingEffectMode = ShadingEffectMode.Three;
Chart3.Type = ChartType.Gauges;
Chart3.DefaultAxis.TickNumberMaximum = 9;
Chart3.DefaultAxis.TickLabelPadding = 8;
Chart3.DefaultAxis.MinorTicksPerInterval = 1;
Chart3.DefaultAxis.DefaultTick.Line.Length = 10;
Chart3.DefaultAxis.DefaultTick.Label.Font = new Font("Tahoma", 8, FontStyle.Bold);
Chart3.DefaultAxis.DefaultMinorTick.Line.Color = Color.White;
Chart3.DefaultSeries.Background.Color = Color.FromArgb(240, 240, 240);
Chart3.ChartArea.ClearColors();
double avQ = getAvQuantity();
double avT = getAvAmount();
Series s1 = new Series("Average Quantity", new Element("", avQ));
Series s2 = new Series("Average Amount", new Element("", avT));
s1.YAxis = new Axis();
s1.YAxis.Markers.Add(new AxisMarker("", Color.Red, 0, 8));
s1.YAxis.Markers.Add(new AxisMarker("", Color.Green, 8, 20));
s1.YAxis.Maximum = 20;
Chart3.YAxis.Markers.Add(new AxisMarker("", Color.Red, 0, 140));
Chart3.YAxis.Markers.Add(new AxisMarker("", Color.Green, 140, 250));
Chart3.YAxis.Maximum = 250;
Chart3.YAxis.DefaultTick.Label.Text = "$%Value";
Chart3.SeriesCollection.Add(s1, s2);
// -------
// ------- Pie
Chart4.MarginBottom = 0;
Chart4.PaletteName = Palette.Bright;
Chart4.Type = ChartType.Pie;
Chart4.ChartArea.ClearColors();
Chart4.LegendBox.DefaultEntry.Value = "";
Chart4.LegendBox.DefaultEntry.Name = "Product %Name";
Chart4.DefaultElement.ShowValue = true;
Chart4.DefaultElement.SmartLabel.Text = "<%YValue,Currency>";
Chart4.DefaultElement.SmartLabel.Font = new Font("Tahoma", 8, FontStyle.Bold);
Chart4.SeriesCollection.Add(getOrdersByProduct());
// -------
}
// Generate a simple grid based on the provided series collection.
string generateMarkup(SeriesCollection sc)
{
// If all series dont have the same number of of elements it may break the InfoGrid so grouping them can help.
sc.GroupByElements();
string headerStyle = "<block fStyle='bold' fSize='9' hAlign='Center'>";
StringBuilder sb = new StringBuilder();
// Add header titles matching the final number of columns.
sb.Append("<block><block>");
foreach (Element e in sc[0].Elements)
sb.Append(headerStyle + e.Name);
// Horizontal Rule
sb.Append("<hr>");
// Now each row is populated with data.
int i = 0;
foreach (Series s in sc)
{
// A block for alignment and one using the series name. (2 blocks)
sb.Append("<block> <block fStyle='bold' fSize='9'>" + s.Name);
// A block for each element
foreach (Element e in s.Elements)
{
// Use a 0 for empty elements
if (e.YValue == double.NaN)
sb.Append("<block hAlign='Right'>0");
else
sb.Append("<block hAlign='Right'>" + e.YValue.ToString("C"));
}
if (i++ < sc.Count - 1)
sb.Append("<row>");
}
sb.Append("<hr>");
// Add a row of totals
sb.Append("<block><block fStyle='bold'>Total");
Series sum = sc.Calculate("", Calculation.Sum);
// For each calculated element.
foreach (Element e in sum.Elements)
{
if (e.YValue == double.NaN)
sb.Append("<block hAlign='Right'> 0");
else
sb.Append("<block hAlign='Right'> " + e.YValue.ToString("C"));
}
return sb.ToString();
}
// Takes a series and returns a series collection that includes a trend series as well.
SeriesCollection withTrend(Series s, string name)
{
SeriesCollection result = new SeriesCollection();
Series trend = (new SeriesCollection(s)).Calculate(name, Calculation.TrendLineLinear);
trend.Type = SeriesType.Line;
trend.DefaultElement.Marker.Visible = false;
trend.LegendEntry.Visible = false;
trend.DefaultElement.Color = Color.Black;
trend.Line.EndCap = LineCap.ArrowAnchor;
trend.Line.AnchorCapScale = 2;
trend.Line.Width = 2;
if (trend.Elements.Count > 0)
{
s.YAxis = trend.YAxis = new Axis();
AxisMarker am = new AxisMarker("", Color.Red, trend[0].YValue);
am.LegendEntry.Visible = false;
am.Line.DashStyle = DashStyle.Dash;
s.YAxis.Markers.Add(am);
}
result.Add(s, trend);
return result;
}
SeriesCollection getOrders()
{
DataEngine de = new DataEngine(ConfigurationManager.AppSettings["DNCConnectionString"]);
de.StartDate = new System.DateTime(2022, 1, 1, 0, 0, 0);
de.EndDate = new System.DateTime(2022, 12, 31, 23, 59, 59);
de.DateGrouping = TimeInterval.Year;
de.SqlStatement = @"SELECT OrderDate,Sum(Quantity) FROM Orders WHERE OrderDate >= #STARTDATE# AND OrderDate <= #ENDDATE# GROUP BY Orders.OrderDate ORDER BY Orders.OrderDate";
return de.GetSeries();
}
double getAvQuantity()
{
DataEngine de = new DataEngine(ConfigurationManager.AppSettings["DNCConnectionString"]);
de.StartDate = new System.DateTime(2022, 1, 1, 0, 0, 0);
de.EndDate = new System.DateTime(2022, 12, 31, 23, 59, 59);
de.SqlStatement = @"SELECT OrderDate,Quantity FROM Orders WHERE OrderDate >= #STARTDATE# AND OrderDate <= #ENDDATE# ";
SeriesCollection result = de.GetSeries();
double av = 0;
if (result.Count > 0)
av = result[0].Calculate("", Calculation.Average).YValue;
return av;
}
double getAvAmount()
{
DataEngine de = new DataEngine(ConfigurationManager.AppSettings["DNCConnectionString"]);
de.StartDate = new System.DateTime(2022, 1, 1, 0, 0, 0);
de.EndDate = new System.DateTime(2022, 12, 31, 23, 59, 59);
de.SqlStatement = @"SELECT OrderDate,Total FROM Orders WHERE OrderDate >= #STARTDATE# AND OrderDate <= #ENDDATE# ";
SeriesCollection result = de.GetSeries();
double av = 0;
if (result.Count > 0)
av = result[0].Calculate("", Calculation.Average).YValue;
return av;
}
SeriesCollection getOrdersByProduct()
{
DataEngine de = new DataEngine(ConfigurationManager.AppSettings["DNCConnectionString"]);
de.StartDate = new System.DateTime(2022, 1, 1, 0, 0, 0);
de.EndDate = new System.DateTime(2022, 12, 31, 23, 59, 59);
de.DateGrouping = TimeInterval.Year;
de.SqlStatement = @"SELECT OrderDate,Quantity, ItemNo FROM Orders WHERE OrderDate >= #STARTDATE# AND OrderDate <= #ENDDATE# ORDER BY Orders.OrderDate";
SeriesCollection result = de.GetSeries();
result.Sort(ElementValue.Name, "ASC");
return result;
}
</script>
<html xmlns="http://www.w3.org/1999/xhtml">
<head>
<title>.netCHARTING Sample</title>
</head>
<body>
<div align="center">
<table style="width: 800px">
<tr>
<td>
<dotnet:Chart ID="Chart" runat="server" />
</td>
<td>
<dotnet:Chart ID="Chart4" runat="server" />
</td>
</tr>
<tr>
<td colspan="2">
<table style="width: 100%">
<tr>
<td>
<dotnet:Chart ID="Chart2" runat="server" />
</td>
</tr>
</table>
</td>
</tr>
<tr>
<td colspan="2">
<table style="width: 100%">
<tr>
<td>
<dotnet:Chart ID="Chart1" runat="server" />
</td>
<td>
<dotnet:Chart ID="Chart3" runat="server" />
</td>
</tr>
</table>
</td>
</tr>
</table>
</div>
</body>
</html>
<%@ Page Language="vb" Description="dotnetCHARTING Component" %>
<%@ Register TagPrefix="dotnet" Namespace="dotnetCHARTING" Assembly="dotnetCHARTING" %>
<%@ Import Namespace="System.Drawing" %>
<%@ Import Namespace="System.Drawing.Drawing2D" %>
<script runat="server">
''' <summary>
''' Apply common settings for all charts.
''' </summary>
Sub setChart_Renamed(ByVal c As Chart)
'c.TitleBox.Background.ShadingEffectMode = ShadingEffectMode.Four;
c.TitleBox.Background.Color = Color.Lavender
c.TitleBox.Label.Color = Color.MidnightBlue
c.DefaultLegendBox.DefaultEntry.LabelStyle.Color = c.TitleBox.Label.Color
c.TitleBox.CornerTopLeft = BoxCorner.Round
c.TitleBox.CornerTopRight = BoxCorner.Round
c.DefaultLegendBox.DefaultEntry.LabelStyle.Font = New Font("Tahoma", 8, FontStyle.Bold)
'c.ShadingEffectMode = ShadingEffectMode.Two;
c.TitleBox.Position = TitleBoxPosition.FullWithLegend
c.TempDirectory = "temp"
End Sub
Sub Page_Load(ByVal sender As Object, ByVal e As EventArgs)
' Demonstrates a database driven digital dashboards utilizing a number of chart types.
' The chart layour is as follows:
' Chart Chart4
' Chart2
' Chart1 Chart3
' Apply common settings to each chart.
setChart_Renamed(Chart)
setChart_Renamed(Chart1)
setChart_Renamed(Chart2)
setChart_Renamed(Chart3)
setChart_Renamed(Chart4)
' Set sizes for each individually.
Chart.Size = "500x240"
Chart4.Size = "300x240"
Chart2.Size = "800,100"
Chart3.Size = "220x380"
Chart1.Size = "580,380"
' ------- Chart setup
Chart.MarginTop = 1
Chart.Palette = New Color() { Color.Gray }
Chart.ChartArea.ClearColors()
Chart.ShowDateInTitle = False
Chart.Title = "2022 Sales (totals)"
Chart.YAxis.Scale = Scale.Range
Chart.YAxis.Line = New Line(Color.LightGray, 1)
Chart.DefaultFormatString = "Currency"
Chart.SeriesCollection.Add(getOrders())
' -------
' ------- Chart1 Setup
Chart1.MarginTop = 2
Chart1.PaletteName = Palette.Bright
Chart1.DefaultFormatString = "Currency"
Chart1.DefaultLegendBox.DefaultEntry.Name = ""
Chart1.DefaultAxis.DefaultTick.GridLine.Color = Color.Empty
Chart1.DefaultAxis.AlternateGridBackground.Color = Color.Empty
Chart1.DefaultAxis.TickNumberMaximum = 4
Chart1.DefaultAxis.Scale = Scale.Range
Chart1.DefaultChartArea.Background.Color = Color.FromArgb(240, 240, 240)
Chart1.DefaultChartArea.Label.Font = New Font("Arial", 15)
Chart1.DefaultChartArea.Label.Alignment = StringAlignment.Far
Chart1.DefaultElement.Marker.Visible = False
Chart1.LegendBox.Orientation = dotnetCHARTING.Orientation.Top
' Add a legend entry to represent the trends.
Chart1.LegendBox.ExtraEntries.Add(New LegendEntry("", "Trends", Color.Black))
Chart1.LegendBox.ExtraEntries(0).SeriesType = SeriesType.Line
Chart1.LegendBox.ExtraEntries(0).SortOrder = -1
Dim mySCbp As SeriesCollection = getOrdersByProduct()
Chart1.SeriesCollection.Add(withTrend(mySCbp(0), "t0"))
Dim ca1 As ChartArea = New ChartArea(withTrend(mySCbp(1), "t1"))
Dim ca2 As ChartArea = New ChartArea(withTrend(mySCbp(2), "t2"))
Chart1.ChartArea.Label.Text = "Product 1"
ca1.Label.Text = "Product 2"
ca2.Label.Text = "Product 3"
ca1.TitleBox.Position = TitleBoxPosition.FullWithLegend
ca2.TitleBox.Position = TitleBoxPosition.FullWithLegend
ca1.TitleBox.CornerTopRight = BoxCorner.Round
ca2.TitleBox.CornerTopRight = BoxCorner.Round
Chart1.ExtraChartAreas.Add(ca1, ca2)
' -------
' ------- Chart 2 Setup
Chart2.ObjectChart = generateMarkup(getOrdersByProduct())
' -------
' ------- Chart 3 Setup
Chart3.Title = "2022 Averages Per Transaction"
Chart3.Palette = New Color() { Color.Gray }
Chart3.LegendBox.Visible = False
Chart3.TitleBox.Position = TitleBoxPosition.Full
'Chart3.ShadingEffectMode = ShadingEffectMode.Three;
Chart3.Type = ChartType.Gauges
Chart3.DefaultAxis.TickNumberMaximum = 9
Chart3.DefaultAxis.TickLabelPadding = 8
Chart3.DefaultAxis.MinorTicksPerInterval = 1
Chart3.DefaultAxis.DefaultTick.Line.Length = 10
Chart3.DefaultAxis.DefaultTick.Label.Font = New Font("Tahoma", 8, FontStyle.Bold)
Chart3.DefaultAxis.DefaultMinorTick.Line.Color = Color.White
Chart3.DefaultSeries.Background.Color = Color.FromArgb(240, 240, 240)
Chart3.ChartArea.ClearColors()
Dim avQ As Double = getAvQuantity()
Dim avT As Double = getAvAmount()
Dim s1 As Series = New Series("Average Quantity", New Element("", avQ))
Dim s2 As Series = New Series("Average Amount", New Element("", avT))
s1.YAxis = New Axis()
s1.YAxis.Markers.Add(New AxisMarker("", Color.Red, 0, 8))
s1.YAxis.Markers.Add(New AxisMarker("", Color.Green, 8, 20))
s1.YAxis.Maximum = 20
Chart3.YAxis.Markers.Add(New AxisMarker("", Color.Red, 0, 140))
Chart3.YAxis.Markers.Add(New AxisMarker("", Color.Green, 140, 250))
Chart3.YAxis.Maximum = 250
Chart3.YAxis.DefaultTick.Label.Text = "$%Value"
Chart3.SeriesCollection.Add(s1, s2)
' -------
' ------- Pie
Chart4.MarginBottom = 0
Chart4.PaletteName = Palette.Bright
Chart4.Type = ChartType.Pie
Chart4.ChartArea.ClearColors()
Chart4.LegendBox.DefaultEntry.Value = ""
Chart4.LegendBox.DefaultEntry.Name = "Product %Name"
Chart4.DefaultElement.ShowValue = True
Chart4.DefaultElement.SmartLabel.Text = "<%YValue,Currency>"
Chart4.DefaultElement.SmartLabel.Font = New Font("Tahoma", 8, FontStyle.Bold)
Chart4.SeriesCollection.Add(getOrdersByProduct())
' -------
End Sub
' Generate a simple grid based on the provided series collection.
Function generateMarkup(ByVal sc As SeriesCollection) As String
' If all series dont have the same number of of elements it may break the InfoGrid so grouping them can help.
sc.GroupByElements()
Dim headerStyle As String = "<block fStyle='bold' fSize='9' hAlign='Center'>"
Dim sb As StringBuilder = New StringBuilder()
' Add header titles matching the final number of columns.
sb.Append("<block><block>")
For Each e As Element In sc(0).Elements
sb.Append(headerStyle & e.Name)
Next e
' Horizontal Rule
sb.Append("<hr>")
' Now each row is populated with data.
Dim i As Integer = 0
For Each s As Series In sc
' A block for alignment and one using the series name. (2 blocks)
sb.Append("<block> <block fStyle='bold' fSize='9'>" & s.Name)
' A block for each element
For Each e As Element In s.Elements
' Use a 0 for empty elements
If e.YValue = Double.NaN Then
sb.Append("<block hAlign='Right'>0")
Else
sb.Append("<block hAlign='Right'>" & e.YValue.ToString("C"))
End If
Next e
If i < sc.Count - 1 Then
sb.Append("<row>")
End If
i = i + 1
Next s
sb.Append("<hr>")
' Add a row of totals
sb.Append("<block><block fStyle='bold'>Total")
Dim sum As Series = sc.Calculate("", Calculation.Sum)
' For each calculated element.
For Each e As Element In sum.Elements
If e.YValue = Double.NaN Then
sb.Append("<block hAlign='Right'> 0")
Else
sb.Append("<block hAlign='Right'> " & e.YValue.ToString("C"))
End If
Next e
Return sb.ToString()
End Function
' Takes a series and returns a series collection that includes a trend series as well.
Function withTrend(ByVal s As Series, ByVal name As String) As SeriesCollection
Dim result As SeriesCollection = New SeriesCollection()
Dim trend As Series = (New SeriesCollection(s)).Calculate(name, Calculation.TrendLineLinear)
trend.Type = SeriesType.Line
trend.DefaultElement.Marker.Visible = False
trend.LegendEntry.Visible = False
trend.DefaultElement.Color = Color.Black
trend.Line.EndCap = LineCap.ArrowAnchor
trend.Line.AnchorCapScale = 2
trend.Line.Width = 2
If trend.Elements.Count > 0 Then
trend.YAxis = New Axis()
s.YAxis = trend.YAxis
Dim am As AxisMarker = New AxisMarker("", Color.Red, trend(0).YValue)
am.LegendEntry.Visible = False
am.Line.DashStyle = DashStyle.Dash
s.YAxis.Markers.Add(am)
End If
result.Add(s, trend)
Return result
End Function
Function getOrders() As SeriesCollection
Dim de As DataEngine = New DataEngine(ConfigurationManager.AppSettings("DNCConnectionString"))
de.StartDate = New System.DateTime(2022, 1, 1, 0, 0, 0)
de.EndDate = New System.DateTime(2022, 12, 31, 23, 59, 59)
de.DateGrouping = TimeInterval.Year
de.SqlStatement = "SELECT OrderDate,Sum(Quantity) FROM Orders WHERE OrderDate >= #STARTDATE# AND OrderDate <= #ENDDATE# GROUP BY Orders.OrderDate ORDER BY Orders.OrderDate"
Return de.GetSeries()
End Function
Function getAvQuantity() As Double
Dim de As DataEngine = New DataEngine(ConfigurationManager.AppSettings("DNCConnectionString"))
de.StartDate = New System.DateTime(2022, 1, 1, 0, 0, 0)
de.EndDate = New System.DateTime(2022, 12, 31, 23, 59, 59)
de.SqlStatement = "SELECT OrderDate,Quantity FROM Orders WHERE OrderDate >= #STARTDATE# AND OrderDate <= #ENDDATE# "
Dim result As SeriesCollection = de.GetSeries()
Dim av As Double = 0
If result.Count > 0 Then
av = result(0).Calculate("", Calculation.Average).YValue
End If
Return av
End Function
Function getAvAmount() As Double
Dim de As DataEngine = New DataEngine(ConfigurationManager.AppSettings("DNCConnectionString"))
de.StartDate = New System.DateTime(2022, 1, 1, 0, 0, 0)
de.EndDate = New System.DateTime(2022, 12, 31, 23, 59, 59)
de.SqlStatement = "SELECT OrderDate,Total FROM Orders WHERE OrderDate >= #STARTDATE# AND OrderDate <= #ENDDATE# "
Dim result As SeriesCollection = de.GetSeries()
Dim av As Double = 0
If result.Count > 0 Then
av = result(0).Calculate("", Calculation.Average).YValue
End If
Return av
End Function
Function getOrdersByProduct() As SeriesCollection
Dim de As DataEngine = New DataEngine(ConfigurationManager.AppSettings("DNCConnectionString"))
de.StartDate = New System.DateTime(2022, 1, 1, 0, 0, 0)
de.EndDate = New System.DateTime(2022, 12, 31, 23, 59, 59)
de.DateGrouping = TimeInterval.Year
de.SqlStatement = "SELECT OrderDate,Quantity, ItemNo FROM Orders WHERE OrderDate >= #STARTDATE# AND OrderDate <= #ENDDATE# ORDER BY Orders.OrderDate"
Dim result As SeriesCollection = de.GetSeries()
result.Sort(ElementValue.Name, "ASC")
Return result
End Function
</script>
<html xmlns="http://www.w3.org/1999/xhtml">
<head>
<title>.netCHARTING Sample</title>
</head>
<body>
<div align="center">
<table style="width: 800px">
<tr>
<td>
<dotnet:Chart ID="Chart" runat="server" />
</td>
<td>
<dotnet:Chart ID="Chart4" runat="server" />
</td>
</tr>
<tr>
<td colspan="2">
<table style="width: 100%">
<tr>
<td>
<dotnet:Chart ID="Chart2" runat="server" />
</td>
</tr>
</table>
</td>
</tr>
<tr>
<td colspan="2">
<table style="width: 100%">
<tr>
<td>
<dotnet:Chart ID="Chart1" runat="server" />
</td>
<td>
<dotnet:Chart ID="Chart3" runat="server" />
</td>
</tr>
</table>
</td>
</tr>
</table>
</div>
</body>
</html>
- Sample FilenameDashboardMatrix.aspx
- Version5.2
- Uses DatabaseYes