Gallery
Annotation Header Image
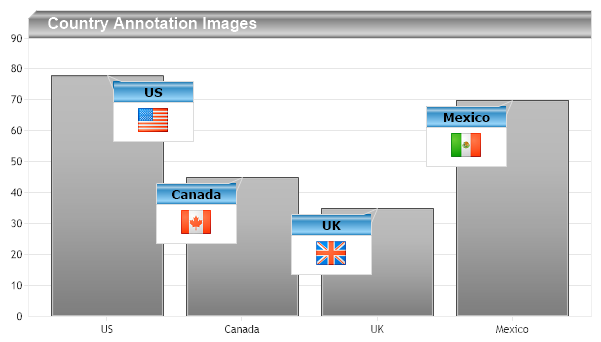
Demonstrates replacing labels with images anywhere a label can go.
- Sample FilenameAnnotationHeaderImage.aspx
- Version5.0
- Uses DatabaseNo