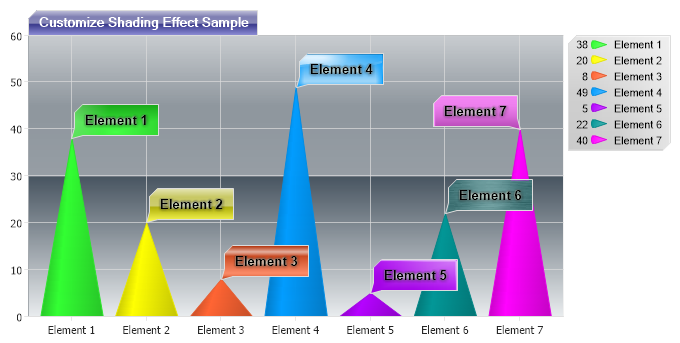
Box Shading Effects
Demonstrates ShadingEffectModes with the background object.
<%@ Page Language="C#" Description="dotnetCHARTING Component" %>
<%@ Register TagPrefix="dotnet" Namespace="dotnetCHARTING" Assembly="dotnetCHARTING" %>
<%@ Import Namespace="System.Drawing" %>
<%@ Import Namespace="System.Drawing.Drawing2D" %>
<script runat="server">
void Page_Load(Object sender, EventArgs e)
{
// Demonstrates ShadingEffectModes with the background object.
Chart.TempDirectory = "temp";
Chart.Debug = true;
Chart.DefaultSeries.Palette = new Color[] { Color.FromArgb(49, 255, 49), Color.FromArgb(255, 255, 0), Color.FromArgb(255, 99, 49), Color.FromArgb(0, 156, 255), Color.FromArgb(180, 0, 255), Color.FromArgb(0, 150, 150), Color.FromArgb(255, 0, 255) };
Chart.Type = ChartType.Combo;
Chart.DefaultSeries.Type = SeriesType.Cone;
Chart.Size = "680x350";
Chart.Title = "Customize Shading Effect Sample";
//Chart.LegacyMode = true;
Chart.ChartArea.YAxis.AlternateGridBackground.Color = Color.Empty;
Chart.TitleBox.Label.Color = Color.White;
Chart.TitleBox.Padding = 5;
Chart.TitleBox.Label.Font = new Font("tahoma, geneva, sans-serif", 10f, FontStyle.Bold) ;
Chart.TitleBox.Background.Color = Color.FromArgb(100, 100, 200);
Chart.LegendBox.Background.Color = Color.FromArgb(225, 225, 225);
Chart.TitleBox.Background.ShadingEffectMode = ShadingEffectMode.Two;
Chart.LegendBox.Background.ShadingEffectMode = ShadingEffectMode.Five;
Chart.ChartArea.Background.ShadingEffectMode = ShadingEffectMode.Two;
// *DYNAMIC DATA NOTE*
// This sample uses random data to populate the chart. To populate
// a chart with database data see the following resources:
// - Use the getLiveData() method using the dataEngine to query a database.
// - Help File > Getting Started > Data Tutorials
// - DataEngine Class in the help file
// - Sample: features/DataEngine.aspx
SeriesCollection mySC = getRandomData();
// Add the random data.
Chart.SeriesCollection.Add(mySC);
mySC[0][0].Annotation.Background.ShadingEffectMode = ShadingEffectMode.One;
mySC[0][1].Annotation.Background.ShadingEffectMode = ShadingEffectMode.Two;
mySC[0][2].Annotation.Background.ShadingEffectMode = ShadingEffectMode.Three;
mySC[0][3].Annotation.Background.ShadingEffectMode = ShadingEffectMode.Four;
mySC[0][4].Annotation.Background.ShadingEffectMode = ShadingEffectMode.Five;
mySC[0][5].Annotation.Background.ShadingEffectMode = ShadingEffectMode.Six;
mySC[0][6].Annotation.Background.ShadingEffectMode = ShadingEffectMode.Seven;
mySC[0][6].Annotation.Orientation = dotnetCHARTING.Orientation.TopLeft;
}
SeriesCollection getRandomData()
{
Random myR = new Random(2);
SeriesCollection SC = new SeriesCollection();
int a = 0;
int b = 0;
for (a = 1; a < 2; a++)
{
Series s = new Series("Series " + a.ToString());
for (b = 1; b < 8; b++)
{
Element e = new Element("Element " + b.ToString());
e.YValue = myR.Next(50);
if (b==6) e.YValue = e.YValue + 7;
e.Annotation = new Annotation("%Name");
e.Annotation.Label.Font = new Font("Arial", 10, FontStyle.Bold);
e.Annotation.Label.Color = Color.Black;
e.Annotation.Label.Shadow.Color = Color.White;
e.Annotation.Padding = 8;
e.Annotation.Label.GlowColor = Color.Honeydew;
e.Annotation.Label.Shadow.Depth = 0;
e.Annotation.Orientation = dotnetCHARTING.Orientation.TopRight;
e.Annotation.DynamicSize = false;
e.Annotation.Background.Color = Chart.DefaultSeries.Palette[b-1];
s.Elements.Add(e);
}
SC.Add(s);
}
return SC;
}
SeriesCollection getLiveData()
{
DataEngine de = new DataEngine("ConnectionString goes here");
de.ChartObject = Chart; // Necessary to view any errors the dataEngine may throw.
de.SqlStatement = "SELECT XAxisColumn, YAxisColumn FROM ....";
return de.GetSeries();
}
</script>
<html xmlns="http://www.w3.org/1999/xhtml">
<head>
<title>.netCHARTING Sample</title>
</head>
<body>
<div align="center">
<dotnet:Chart ID="Chart" runat="server" />
</div>
</body>
</html>
<%@ Page Language="vb" Description="dotnetCHARTING Component" %>
<%@ Register TagPrefix="dotnet" Namespace="dotnetCHARTING" Assembly="dotnetCHARTING" %>
<%@ Import Namespace="System.Drawing" %>
<%@ Import Namespace="System.Drawing.Drawing2D" %>
<script runat="server">
Sub Page_Load(ByVal sender As Object, ByVal e As EventArgs)
' Demonstrates ShadingEffectModes with the background object.
Chart.TempDirectory = "temp"
Chart.Debug = True
Chart.DefaultSeries.Palette = New Color() { Color.FromArgb(49, 255, 49), Color.FromArgb(255, 255, 0), Color.FromArgb(255, 99, 49), Color.FromArgb(0, 156, 255), Color.FromArgb(180, 0, 255), Color.FromArgb(0, 150, 150), Color.FromArgb(255, 0, 255) }
Chart.Type = ChartType.Combo
Chart.DefaultSeries.Type = SeriesType.Cone
Chart.Size = "680x350"
Chart.Title = "Customize Shading Effect Sample"
'Chart.LegacyMode = true;
Chart.ChartArea.YAxis.AlternateGridBackground.Color = Color.Empty
Chart.TitleBox.Label.Color = Color.White
Chart.TitleBox.Padding = 5
Chart.TitleBox.Label.Font = New Font("tahoma, geneva, sans-serif", 10f, FontStyle.Bold)
Chart.TitleBox.Background.Color = Color.FromArgb(100, 100, 200)
Chart.LegendBox.Background.Color = Color.FromArgb(225, 225, 225)
Chart.TitleBox.Background.ShadingEffectMode = ShadingEffectMode.Two
Chart.LegendBox.Background.ShadingEffectMode = ShadingEffectMode.Five
Chart.ChartArea.Background.ShadingEffectMode = ShadingEffectMode.Two
' *DYNAMIC DATA NOTE*
' This sample uses random data to populate the chart. To populate
' a chart with database data see the following resources:
' - Use the getLiveData() method using the dataEngine to query a database.
' - Help File > Getting Started > Data Tutorials
' - DataEngine Class in the help file
' - Sample: features/DataEngine.aspx
Dim mySC As SeriesCollection = getRandomData()
' Add the random data.
Chart.SeriesCollection.Add(mySC)
mySC(0)(0).Annotation.Background.ShadingEffectMode = ShadingEffectMode.One
mySC(0)(1).Annotation.Background.ShadingEffectMode = ShadingEffectMode.Two
mySC(0)(2).Annotation.Background.ShadingEffectMode = ShadingEffectMode.Three
mySC(0)(3).Annotation.Background.ShadingEffectMode = ShadingEffectMode.Four
mySC(0)(4).Annotation.Background.ShadingEffectMode = ShadingEffectMode.Five
mySC(0)(5).Annotation.Background.ShadingEffectMode = ShadingEffectMode.Six
mySC(0)(6).Annotation.Background.ShadingEffectMode = ShadingEffectMode.Seven
mySC(0)(6).Annotation.Orientation = dotnetCHARTING.Orientation.TopLeft
End Sub
Function getRandomData() As SeriesCollection
Dim myR As Random = New Random(2)
Dim SC As SeriesCollection = New SeriesCollection()
Dim a As Integer = 0
Dim b As Integer = 0
For a = 1 To 1
Dim s As Series = New Series("Series " & a.ToString())
For b = 1 To 7
Dim e As Element = New Element("Element " & b.ToString())
e.YValue = myR.Next(50)
If b=6 Then
e.YValue = e.YValue + 7
End If
e.Annotation = New Annotation("%Name")
e.Annotation.Label.Font = New Font("Arial", 10, FontStyle.Bold)
e.Annotation.Label.Color = Color.Black
e.Annotation.Label.Shadow.Color = Color.White
e.Annotation.Padding = 8
e.Annotation.Label.GlowColor = Color.Honeydew
e.Annotation.Label.Shadow.Depth = 0
e.Annotation.Orientation = dotnetCHARTING.Orientation.TopRight
e.Annotation.DynamicSize = False
e.Annotation.Background.Color = Chart.DefaultSeries.Palette(b-1)
s.Elements.Add(e)
Next b
SC.Add(s)
Next a
Return SC
End Function
Function getLiveData() As SeriesCollection
Dim de As DataEngine = New DataEngine("ConnectionString goes here")
de.ChartObject = Chart ' Necessary to view any errors the dataEngine may throw.
de.SqlStatement = "SELECT XAxisColumn, YAxisColumn FROM ...."
Return de.GetSeries()
End Function
</script>
<html xmlns="http://www.w3.org/1999/xhtml">
<head>
<title>.netCHARTING Sample</title>
</head>
<body>
<div align="center">
<dotnet:Chart ID="Chart" runat="server" />
</div>
</body>
</html>