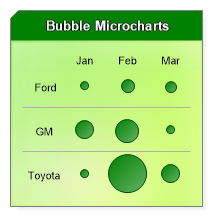
<%@ Page Language="C#" Description="dotnetCHARTING Component" %><%@ Register TagPrefix="dnc" Namespace="dotnetCHARTING" Assembly="dotnetCHARTING" %><%@ Import Namespace="System.Drawing" %><script runat="server"> void Page_Load(Object sender, EventArgs e) { // Demonstrates creating a chart that draws only an annotation. Chart.TempDirectory = "temp"; Chart.Debug = true; Chart.Size = "200x200"; // Create the annotation. Annotation an = new Annotation(getText()); an.DynamicSize = false; an.Padding = 10; an.HeaderLabel.Text = "<block fStyle='bold' fSize='10' fColor='White'>Bubble Microcharts"; an.HeaderLabel.OutlineColor = Color.Black; an.HeaderBackground.Color = Color.Green; an.Background.Color = Color.GreenYellow; an.Background.ShadingEffectMode = ShadingEffectMode.Background2; // Use the annotation to create the chart. Chart.ObjectChart = an; } // Gets some infoGrid text. string getText() { string s = "<Chart:Spacer size='1x1'><Chart:Spacer size='30x1'><Chart:Spacer size='40x1'><Chart:Spacer size='40x1'><Chart:Spacer size='40x1'><row>"; s += "<block><block><block>Jan<block>Feb<block>Mar<row>"; s += "<Chart:Spacer size='1x40'> Ford<Chart:Marker color='green' size='10'><Chart:Marker color='green' size='15'><Chart:Marker color='green' size='13'><hr>"; s += "<Chart:Spacer size='1x40'>GM<Chart:Marker color='green' size='20'><Chart:Marker color='green' size='25'><Chart:Marker color='green' size='10'><hr>"; s += "<Chart:Spacer size='1x40'>Toyota<Chart:Marker color='green' size='10'><Chart:Marker color='green' size='40'><Chart:Marker color='green' size='20'><row>"; return s; }</script><html xmlns="http://www.w3.org/1999/xhtml"><head> <title>.netCHARTING Sample</title></head><body> <div align="center"> <dnc:Chart ID="Chart" runat="server" /> </div></body></html>
<%@ Page Language="vb" Description="dotnetCHARTING Component" %><%@ Register TagPrefix="dnc" Namespace="dotnetCHARTING" Assembly="dotnetCHARTING" %><%@ Import Namespace="System.Drawing" %><script runat="server"> Sub Page_Load(ByVal sender As Object, ByVal e As EventArgs) ' Demonstrates creating a chart that draws only an annotation. Chart.TempDirectory = "temp" Chart.Debug = True Chart.Size = "200x200" ' Create the annotation. Dim an As Annotation = New Annotation(getText()) an.DynamicSize = False an.Padding = 10 an.HeaderLabel.Text = "<block fStyle='bold' fSize='10' fColor='White'>Bubble Microcharts" an.HeaderLabel.OutlineColor = Color.Black an.HeaderBackground.Color = Color.Green an.Background.Color = Color.GreenYellow an.Background.ShadingEffectMode = ShadingEffectMode.Background2 ' Use the annotation to create the chart. Chart.ObjectChart = an End Sub ' Gets some infoGrid text. Function getText() As String Dim s As String = "<Chart:Spacer size='1x1'><Chart:Spacer size='30x1'><Chart:Spacer size='40x1'><Chart:Spacer size='40x1'><Chart:Spacer size='40x1'><row>" s &= "<block><block><block>Jan<block>Feb<block>Mar<row>" s &= "<Chart:Spacer size='1x40'> Ford<Chart:Marker color='green' size='10'><Chart:Marker color='green' size='15'><Chart:Marker color='green' size='13'><hr>" s &= "<Chart:Spacer size='1x40'>GM<Chart:Marker color='green' size='20'><Chart:Marker color='green' size='25'><Chart:Marker color='green' size='10'><hr>" s &= "<Chart:Spacer size='1x40'>Toyota<Chart:Marker color='green' size='10'><Chart:Marker color='green' size='40'><Chart:Marker color='green' size='20'><row>" Return s End Function</script><html xmlns="http://www.w3.org/1999/xhtml"><head> <title>.netCHARTING Sample</title></head><body> <div align="center"> <dnc:Chart ID="Chart" runat="server" /> </div></body></html>