Gallery
Annotation Construction
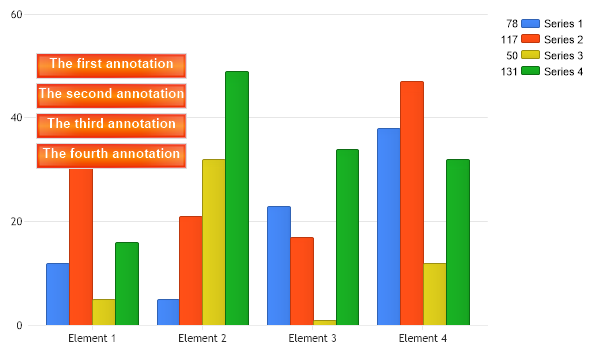
Demonstrates a simple and quick way to create multiple annotations with similar styling.
- Sample FilenameAnnotationConstruction.aspx
- Version5.3
- Uses DatabaseNo