- JS Icon Browser
Demonstrates icon browser with search to view and find all available icons.
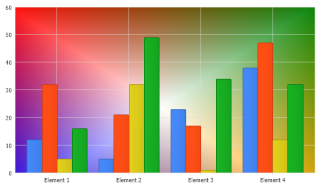
- JS Background Styling
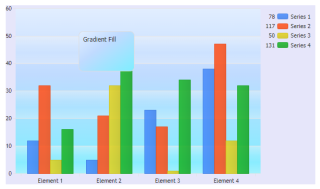
Demonstrates using complex background fills on the chart.
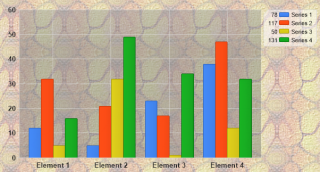
- JS ChartArea Image
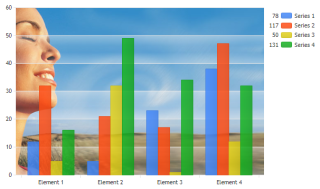
Demonstrates using an image for the chart area of a JSC chart.
- Background Color

Demonstrates background color usage.
- Background Gradient
Demonstrates background gradients usage.
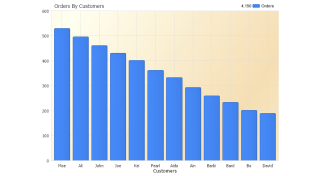
- Background Image
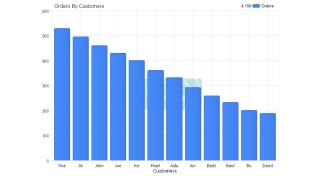
Demonstrates background image usage.
- Background Image Stretch
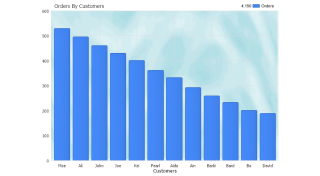
Demonstrates stretched background image usage.
- Background Image Tile
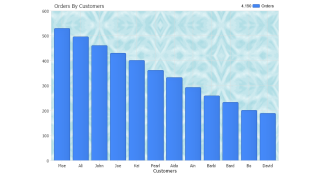
Demonstrates tiled background image usage.
- Bar Fixed Size
Manipulate the bar size of a chart. This is also useful when drilling down data to keep the columns looking the size same.
- Bevel
Give your charts some style using the bevel effect.
- Hatch Enhanced
How columns can be enhanced visually using a hatch style.
- Glass Effect
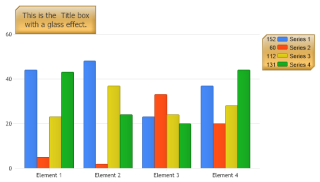
Use the glass effect. This effect works best on box objects.
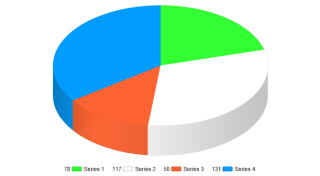
- Floating Pie
Demonstrates floating pies inside a border using the margin and background options.
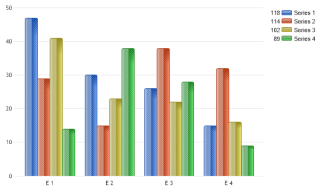
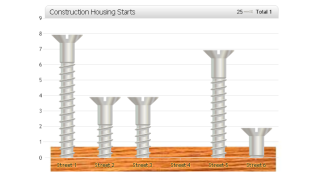
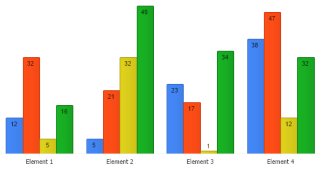
- Image Bars
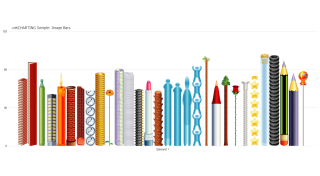
Demonstrates using image bar templates.
- Image Bars 2
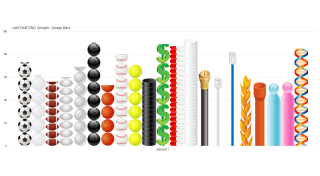
Demonstrates using image bar templates.
- Image Bars 3
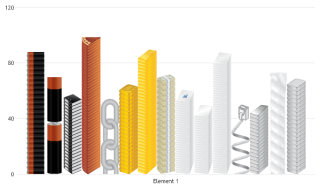
Demonstrates using ImageBar templates.
- Image Bars 4
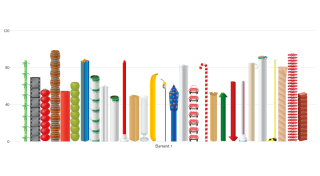
Demonstrates using ImageBar templates.
- Image Bar
Demonstrates image bars, title box customization, image background and axis label outline usage.
- Gradient Line
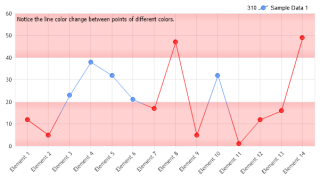
Demonstrates using a multi-color 2D line.
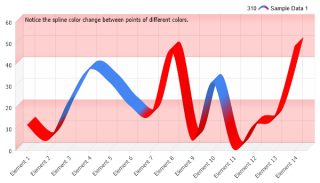
- Gradient Spline

Demonstrates using a multi-color 2D spline.
- Gradient Spline 3D
Demonstrates using a multi-color 3D spline.
- Hatch Pie
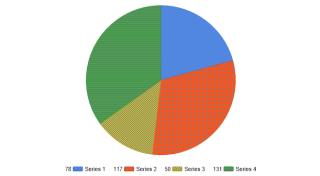
Demonstrates using hatch patterns with a pie chart.
- Brush Background
Demonstrates using a custom brush with a background object.
- Marker Image Color Replace
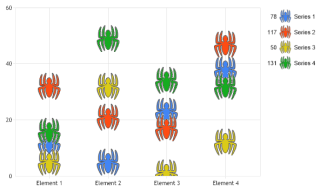
Demonstrates using a single image with a dynamic color to represent elements from different series.
- Dynamic Color Threshold
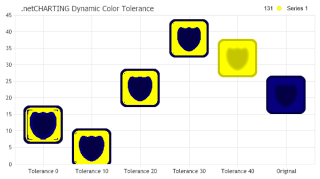
Demonstrates using different dynamic image color tolerance settings and their effects.
- Dynamic Color Threshold 2
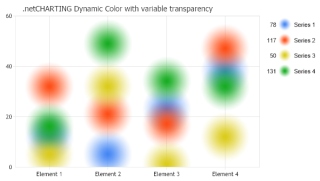
Demonstrates the behavior variable transparency of the dynamic color on custom images.
- Transparent Background
Demonstrates using variable transparency with PNG images.
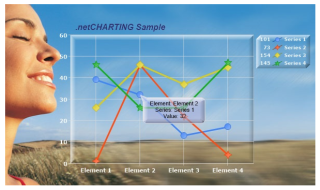
- Floating Chart
Demonstrates a floating combo chart.
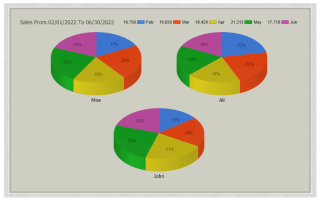
- Color Pie Top Manually
Demonstrates how to manually create a single pie from multiple series using ChartType.Pies and how to color in the top of a 3D pie using the original colors so that 3D shading does not affect it.
- Border Annotation
Demonstrates using an annotation to draw a border around the chart.
- Background Transparency
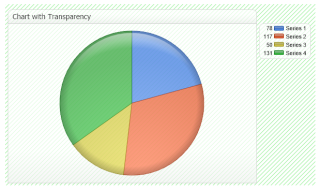
Demonstrates background transparency usage.
- Pie Shading
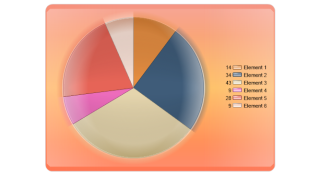
Demonstrates using shading effects and a background box with a pie chart.