- JS Emissions By Income
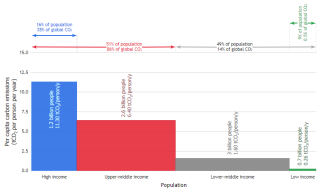
Demonstrates a range ticks with variwide (bar mekko)
- JS UnemploymentRateUS
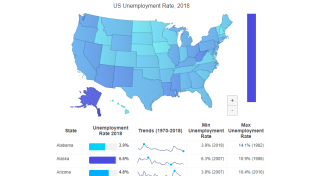
Demonstrates a dashboard with a map and grid with microchart sparklines.
- JS IPhone Prices
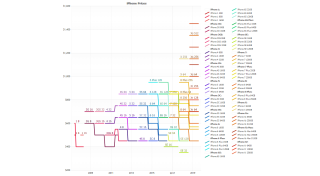
Demonstrates line chart of phone prices and how to draw faux stepped line series.
- JS Heatmap Dense
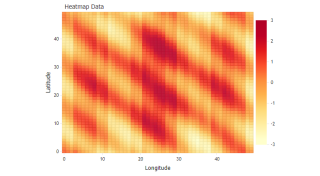
Demonstrates a heatmap chart with smartPalette legend entries.
- JS Gauge Linear
Demonstrates a linear column gauge chart.
- JS Gantt Dependencies
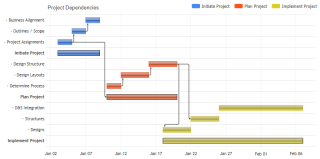
Demonstrates using a grid on the axis and Gantt dependencies.
- JS Datagrid DB
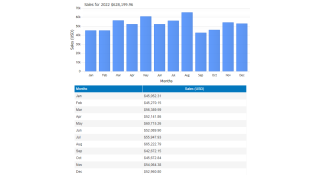
Demonstrates how to generate chart with data grid connected to database.
- JS Aqua Range Columns
Demonstrates range bars with ShadingEffectMode.Two.
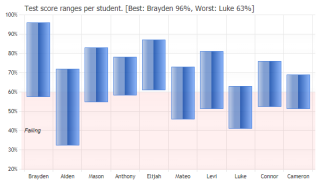
- JS Circular Icons
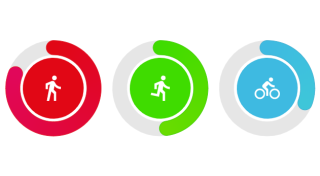
Demonstrates using shape labels with icons on circular column charts.
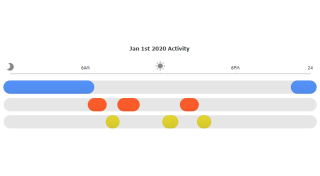
- JS Calendar Details
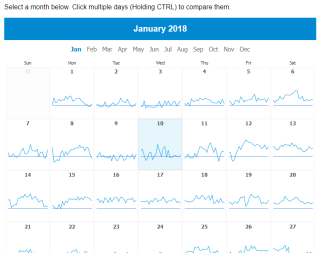
Demonstrates Calendar heatmap with microcharts and details chart based on csv data.
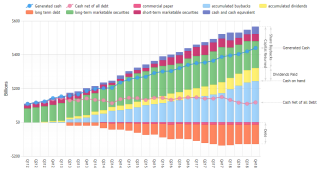
- JS Stacked Sales Bars
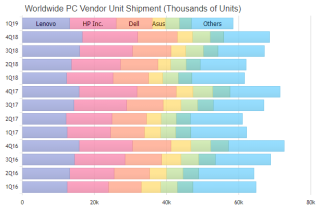
Demonstrates a stacked bar chart with firstPoint labels.
- JS Range AreaLine
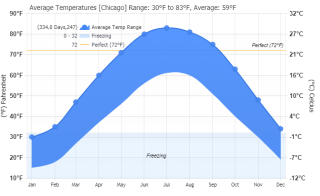
Demonstrates an area range chart with dual axes.
- JS Tires Compared
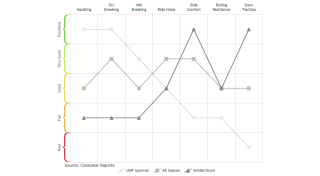
Demonstrates custom curly brace range ticks mapped to tire ratings.
- JS Axis Marker Holidays
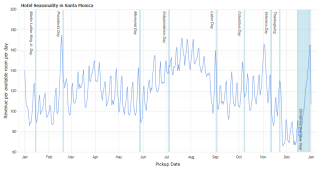
Demonstrates holiday calendar pattern markers showing correlation with hotel traffic.
- JS Range Tick Layout
Demonstrates Custom range ticks with multiple and offset axes.
- JS House Sales Scatter
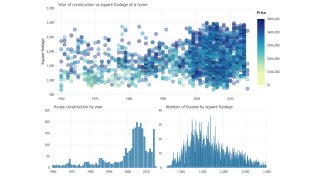
Demonstrates a scatter chart dashboard including column, and area charts.
- JS Water Heating Curve
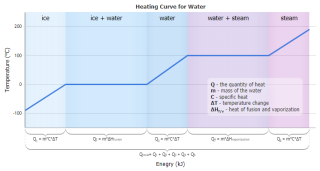
This sample deomonstrates using superscript and subscript label tags to display formulas.
- JS Icon Browser
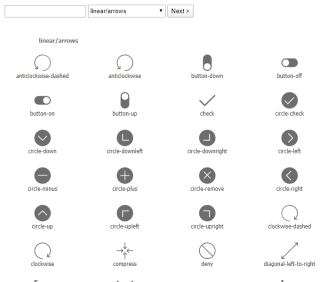
Demonstrates icon browser with search to view and find all available icons.
- Surface 3D
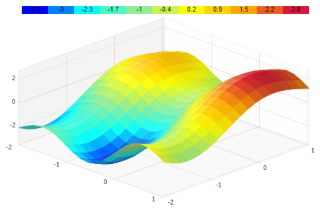
Demonstrates a simple 3D surface chart.
- JS Tree Map Mul SRCol Swatch
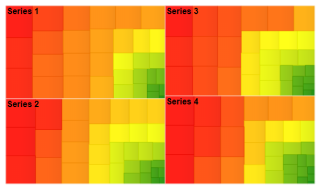
Demonstrates a treeMap chart with a multi-color smart range colors and a color swatch.