Gallery
Hatch Enhanced
<%@ Page Language="C#" Description="dotnetCHARTING Component" %>
<%@ Register TagPrefix="dotnet" Namespace="dotnetCHARTING" Assembly="dotnetCHARTING"%>
<%@ Import Namespace="System.Drawing" %>
<%@ Import Namespace="System.Drawing.Drawing2D" %>
<html xmlns="http://www.w3.org/1999/xhtml">
<head>
<title>.netCHARTING Sample</title>
<script runat="server">
void Page_Load(Object sender,EventArgs e)
{
Chart.Type = ChartType.Combo;
Chart.Width = 600;
Chart.Height = 350;
Chart.TempDirectory = "temp";
Chart.Debug = true;
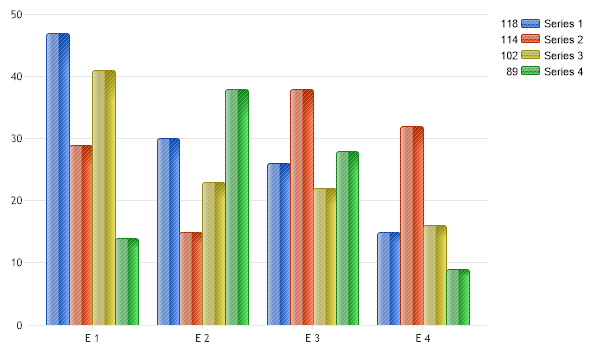
// Demonstrates how columns can be enhanced visually using a hatch style.
// First we get our data, if you would like to get the data from a database you need to use
// the data engine. See sample: features/dataEngine.aspx. Or the dataEngine tutorial in the help file.
SeriesCollection mySC = getRandomData();
Chart.ShadingEffectMode = ShadingEffectMode.Two;
Chart.HatchStylePaletteName = HatchStylePalette.One;
Chart.DefaultSeries.DefaultElement.HatchStyle = HatchStyle.LightUpwardDiagonal;
Chart.DefaultSeries.DefaultElement.HatchColor = Color.FromArgb(100,Color.LightGray);
// Add the random data.
Chart.SeriesCollection.Add(mySC);
}
SeriesCollection getRandomData()
{
SeriesCollection SC = new SeriesCollection();
Random myR = new Random();
for(int a = 1; a < 5; a++)
{
Series s = new Series();
s.Name = "Series " + a;
for(int b = 1; b < 5; b++)
{
Element e = new Element();
e.Name = "E " + b;
e.YValue = myR.Next(50);
s.Elements.Add(e);
}
SC.Add(s);
}
return SC;
}
</script>
</head>
<body>
<div style="text-align:center">
<dotnet:Chart id="Chart" runat="server" Width="568px" Height="344px">
</dotnet:Chart>
</div>
</body>
</html>
<%@ Page Language="vb" Description="dotnetCHARTING Component" %>
<%@ Register TagPrefix="dotnet" Namespace="dotnetCHARTING" Assembly="dotnetCHARTING"%>
<%@ Import Namespace="System.Drawing" %>
<%@ Import Namespace="System.Drawing.Drawing2D" %>
<html xmlns="http://www.w3.org/1999/xhtml">
<head>
<title>.netCHARTING Sample</title>
<script runat="server">
Sub Page_Load(ByVal sender As Object, ByVal e As EventArgs)
Chart.Type = ChartType.Combo
Chart.Width = 600
Chart.Height = 350
Chart.TempDirectory = "temp"
Chart.Debug = True
' Demonstrates how columns can be enhanced visually using a hatch style.
' First we get our data, if you would like to get the data from a database you need to use
' the data engine. See sample: features/dataEngine.aspx. Or the dataEngine tutorial in the help file.
Dim mySC As SeriesCollection = getRandomData()
Chart.ShadingEffectMode = ShadingEffectMode.Two
Chart.HatchStylePaletteName = HatchStylePalette.One
Chart.DefaultSeries.DefaultElement.HatchStyle = HatchStyle.LightUpwardDiagonal
Chart.DefaultSeries.DefaultElement.HatchColor = Color.FromArgb(100,Color.LightGray)
' Add the random data.
Chart.SeriesCollection.Add(mySC)
End Sub
Function getRandomData() As SeriesCollection
Dim SC As SeriesCollection = New SeriesCollection()
Dim myR As Random = New Random()
For a As Integer = 1 To 4
Dim s As Series = New Series()
s.Name = "Series " & a
For b As Integer = 1 To 4
Dim e As Element = New Element()
e.Name = "E " & b
e.YValue = myR.Next(50)
s.Elements.Add(e)
Next b
SC.Add(s)
Next a
Return SC
End Function
</script>
</head>
<body>
<div style="text-align:center">
<dotnet:Chart id="Chart" runat="server" Width="568px" Height="344px">
</dotnet:Chart>
</div>
</body>
</html>
- Sample FilenameHatchEnhanced.aspx
- VersionLegacy (Pre 3.0)
- Uses DatabaseNo