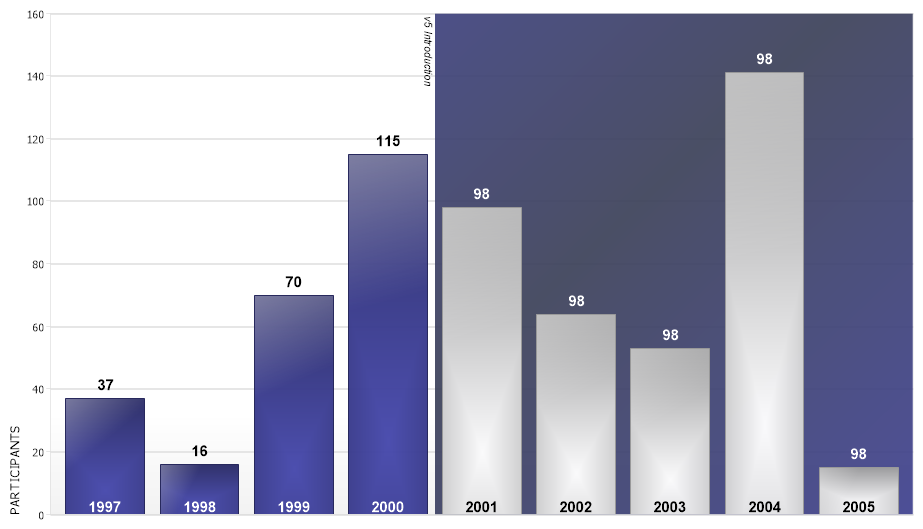
Styled Blue
Demonstrates styling a blue chart.
<%@ Page Language="C#" Description="dotnetCHARTING Component" %>
<%@ Register TagPrefix="dnc" Namespace="dotnetCHARTING" Assembly="dotnetCHARTING" %>
<%@ Import Namespace="System.Drawing" %>
<%@ Import Namespace="System.Drawing.Drawing2D" %>
<%@ Import Namespace="dotnetCHARTING.Mapping" %>
<script runat="server">
void Page_Load(Object sender, EventArgs e)
{
// Demonstrates styling a blue chart.
Chart.Size = "930x524";
Chart.TempDirectory = "temp";
Chart.Debug = true;
Chart.Palette = new Color[] { Color.FromArgb(64, 66, 153), Color.FromArgb(255, 255, 0), Color.FromArgb(255, 99, 49), Color.FromArgb(0, 156, 255) };
Chart.ShadingEffectMode = ShadingEffectMode.One;
Chart.LegendBox.Visible = false;
Chart.ChartArea.Background.Color = Color.White;
// Axis settings
Chart.XAxis.DefaultTick.GridLine.Color = Color.Transparent;
Chart.YAxis.AlternateGridBackground.Color = Color.Transparent;
Chart.YAxis.DefaultTick.GridLine.Width = 2;
Chart.YAxis.Label.Text = "PARTICIPANTS";
Chart.YAxis.Label.Alignment = StringAlignment.Near;
Chart.XAxis.ClearValues = true;
Chart.DefaultElement.ShowValue = true;
Chart.DefaultElement.SmartLabel.Alignment = LabelAlignment.Bottom;
Chart.DefaultElement.SmartLabel.Font = new Font("Arial", 11, FontStyle.Bold);
Chart.DefaultElement.SmartLabel.Text = "%Name";
Chart.DefaultElement.SmartLabel.Color = Color.White;
Annotation an = new Annotation();
an.ClearColors();
an.Label.Text = "%YValue";
an.Label.Font = new Font("Arial", 11, FontStyle.Bold);
an.Label.Color = Color.Black;
an.Orientation = dotnetCHARTING.Orientation.Top;
Chart.DefaultElement.Annotation = an;
// *DYNAMIC DATA NOTE*
// This sample uses random data to populate the chart. To populate
// a chart with database data see the following resources:
// - Use the getLiveData() method using the dataEngine to query a database.
// - Help File > Getting Started > Data Tutorials
// - DataEngine Class in the help file
// - Sample: features/DataEngine.aspx
AxisMarker am = new AxisMarker("v5 Introduction", Color.FromArgb(235,64,66,153), 4, 8);
am.Background.SecondaryColor = Color.FromArgb(235,59, 64, 88);
am.Background.Mode = BackgroundMode.Gradient;
am.Background.GradientAngle = 45;
am.LegendEntry.Visible = false;
am.Label.Alignment = StringAlignment.Near;
am.Label.LineAlignment = StringAlignment.Near;
Chart.XAxis.Markers.Add(am);
SeriesCollection mySC = getRandomData();
Element newE = new Element();
newE.Color = Color.White;
newE.SmartLabel.Color = Color.Black;
Annotation an2 = new Annotation();
an2.Label.Color = Color.White;
newE.Annotation = an2;
mySC.SelectiveElementDefaults(new ScaleRange(5, 10), ElementValue.XValue, newE,true);
// Add the random data.
Chart.SeriesCollection.Add(mySC);
}
SeriesCollection getRandomData()
{
Random myR = new Random(1);
int stY = 1997;
SeriesCollection SC = new SeriesCollection();
for (int a = 1; a < 2; a++)
{
Series s = new Series("Series " + a.ToString());
for (int b = 1; b < 10; b++)
{
Element e = new Element((stY++).ToString());
e.YValue = myR.Next(150);
e.XValue = b;
s.Elements.Add(e);
}
SC.Add(s);
}
return SC;
}
SeriesCollection getLiveData()
{
DataEngine de = new DataEngine(ConfigurationManager.AppSettings["DNCConnectionString"]);
de.ChartObject = Chart; // Necessary to view any errors the dataEngine may throw.
de.SqlStatement = "SELECT XAxisColumn, YAxisColumn FROM ....";
return de.GetSeries();
}
</script>
<html xmlns="http://www.w3.org/1999/xhtml">
<head>
<title>.netCHARTING Sample</title>
</head>
<style type="text/css">
div, p
{
font-family: Arial, Helvetica, sans-serif;
font-size: x-small;
}
</style>
<body>
<div align="center">
<dnc:Chart ID="Chart" runat="server" />
</div>
</body>
</html>
<%@ Page Language="vb" Description="dotnetCHARTING Component" %>
<%@ Register TagPrefix="dnc" Namespace="dotnetCHARTING" Assembly="dotnetCHARTING" %>
<%@ Import Namespace="System.Drawing" %>
<%@ Import Namespace="System.Drawing.Drawing2D" %>
<%@ Import Namespace="dotnetCHARTING.Mapping" %>
<script runat="server">
Sub Page_Load(ByVal sender As Object, ByVal e As EventArgs)
' Demonstrates styling a blue chart.
Chart.Size = "930x524"
Chart.TempDirectory = "temp"
Chart.Debug = True
Chart.Palette = New Color() { Color.FromArgb(64, 66, 153), Color.FromArgb(255, 255, 0), Color.FromArgb(255, 99, 49), Color.FromArgb(0, 156, 255) }
Chart.ShadingEffectMode = ShadingEffectMode.One
Chart.LegendBox.Visible = False
Chart.ChartArea.Background.Color = Color.White
' Axis settings
Chart.XAxis.DefaultTick.GridLine.Color = Color.Transparent
Chart.YAxis.AlternateGridBackground.Color = Color.Transparent
Chart.YAxis.DefaultTick.GridLine.Width = 2
Chart.YAxis.Label.Text = "PARTICIPANTS"
Chart.YAxis.Label.Alignment = StringAlignment.Near
Chart.XAxis.ClearValues = True
Chart.DefaultElement.ShowValue = True
Chart.DefaultElement.SmartLabel.Alignment = LabelAlignment.Bottom
Chart.DefaultElement.SmartLabel.Font = New Font("Arial", 11, FontStyle.Bold)
Chart.DefaultElement.SmartLabel.Text = "%Name"
Chart.DefaultElement.SmartLabel.Color = Color.White
Dim an As Annotation = New Annotation()
an.ClearColors()
an.Label.Text = "%YValue"
an.Label.Font = New Font("Arial", 11, FontStyle.Bold)
an.Label.Color = Color.Black
an.Orientation = dotnetCHARTING.Orientation.Top
Chart.DefaultElement.Annotation = an
' *DYNAMIC DATA NOTE*
' This sample uses random data to populate the chart. To populate
' a chart with database data see the following resources:
' - Use the getLiveData() method using the dataEngine to query a database.
' - Help File > Getting Started > Data Tutorials
' - DataEngine Class in the help file
' - Sample: features/DataEngine.aspx
Dim am As AxisMarker = New AxisMarker("v5 Introduction", Color.FromArgb(235,64,66,153), 4, 8)
am.Background.SecondaryColor = Color.FromArgb(235,59, 64, 88)
am.Background.Mode = BackgroundMode.Gradient
am.Background.GradientAngle = 45
am.LegendEntry.Visible = False
am.Label.Alignment = StringAlignment.Near
am.Label.LineAlignment = StringAlignment.Near
Chart.XAxis.Markers.Add(am)
Dim mySC As SeriesCollection = getRandomData()
Dim newE As Element = New Element()
newE.Color = Color.White
newE.SmartLabel.Color = Color.Black
Dim an2 As Annotation = New Annotation()
an2.Label.Color = Color.White
newE.Annotation = an2
mySC.SelectiveElementDefaults(New ScaleRange(5, 10), ElementValue.XValue, newE,True)
' Add the random data.
Chart.SeriesCollection.Add(mySC)
End Sub
Function getRandomData() As SeriesCollection
Dim myR As Random = New Random(1)
Dim stY As Integer = 1997
Dim SC As SeriesCollection = New SeriesCollection()
For a As Integer = 1 To 1
Dim s As Series = New Series("Series " & a.ToString())
For b As Integer = 1 To 9
Dim e As Element = New Element((stY).ToString())
stY += 1
e.YValue = myR.Next(150)
e.XValue = b
s.Elements.Add(e)
Next b
SC.Add(s)
Next a
Return SC
End Function
Function getLiveData() As SeriesCollection
Dim de As DataEngine = New DataEngine(ConfigurationManager.AppSettings("DNCConnectionString"))
de.ChartObject = Chart ' Necessary to view any errors the dataEngine may throw.
de.SqlStatement = "SELECT XAxisColumn, YAxisColumn FROM ...."
Return de.GetSeries()
End Function
</script>
<html xmlns="http://www.w3.org/1999/xhtml">
<head>
<title>.netCHARTING Sample</title>
</head>
<style type="text/css">
div, p
{
font-family: Arial, Helvetica, sans-serif;
font-size: x-small;
}
</style>
<body>
<div align="center">
<dnc:Chart ID="Chart" runat="server" />
</div>
</body>
</html>