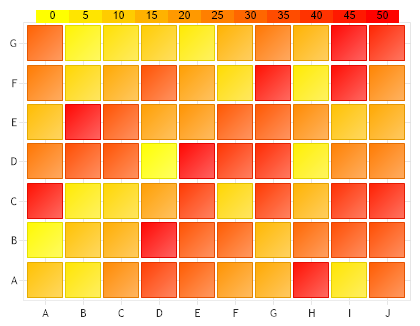
Heat Map Grid
Demonstrates how to create a HeatMap grid using the combo chart type and element markers.
<%@ Page Language="C#" Description="dotnetCHARTING Component" %>
<%@ Register TagPrefix="dnc" Namespace="dotnetCHARTING" Assembly="dotnetCHARTING" %>
<%@ Import Namespace="System.Drawing" %>
<%@ Import Namespace="System.Drawing.Drawing2D" %>
<%@ Import Namespace="dotnetCHARTING.Mapping" %>
<script runat="server">
string[] yLabels = new string[] { "A", "B", "C", "D", "E", "F", "G" };
string[] xLabels = new string[] { "A", "B", "C", "D", "E", "F", "G", "H", "I", "J" };
void Page_Load(Object sender, EventArgs e)
{
// Demonstrates how to create a HeatMap grid using the combo chart type and element markers.
Chart.Size = "420x330";
Chart.TempDirectory = "temp";
Chart.Debug = true;
Chart.LegendBox.Visible = false;
Chart.MarginTop = 25;
// The chart will use large sqare markers for elements.
Chart.DefaultSeries.Type = SeriesType.Marker;
Chart.DefaultElement.Marker.Type = ElementMarkerType.Square;
Chart.DefaultElement.Marker.Size = 38;
// Set the y scale to show only the markers.
Chart.YAxis.Minimum = -.5;
Chart.YAxis.Maximum = yLabels.Length - .45; ;
Chart.DefaultElement.ToolTip = "Value: %BubbleSize";
// *DYNAMIC DATA NOTE*
// This sample uses random data to populate the chart. To populate
// a chart with database data see the following resources:
// - Use the getLiveData() method using the dataEngine to query a database.
// - Help File > Getting Started > Data Tutorials
// - DataEngine Class in the help file
// - Sample: features/DataEngine.aspx
SeriesCollection mySC = getRandomData();
// Add the random data.
Chart.SeriesCollection.Add(mySC);
Chart.YAxis.ClearValues = true;
for (int i = 0; i < yLabels.Length; i++)
{
Chart.YAxis.ExtraTicks.Add(new AxisTick(i, yLabels[i]));
}
Chart.SmartPalette.Add("*", new SmartColor(Color.Yellow, Color.Red, new ScaleRange(0, 50), ElementValue.BubbleSize));
Annotation an = new Annotation(getSwatch(300, Chart.SmartPalette, 10, true));
an.ClearColors();
//an.Line.Color = Color.Black;
an.Position = new Point(7, 5);
an.Size = new Size(420, 20);
Chart.Annotations.Add(an);
}
string getSwatch(int width, SmartPalette sp, int divisions, bool withValues)
{
// Get Maximum Value of the smart palette range
double max = (double)sp.GetScaleRange("*").ValueHigh;
string swatch = "", spacers = "";
// Width of each division.
int boxWidth = width / divisions;
// Generate swatch string for each division.
for (int i = 0; i <= divisions; i++)
{
spacers += "<Chart:Spacer size='" + boxWidth + "x1'>";
// Get the color of the current division.
string color = getHTMLColor(sp.GetValueColor("", (i * (max / divisions))));
if (withValues)
swatch += "<block bgColor='" + color + "' fColor='Black' fStyle='Regular'>" + (i * (max / divisions));
else
swatch += "<block bgColor='" + color + "' fColor='" + color + "'>_";
}
//return the swatch string.
return spacers + "<row>" + swatch;
}
string getHTMLColor(Color c)
{
return "#" + c.R.ToString("X2") + c.G.ToString("X2") + c.B.ToString("X2");
}
SeriesCollection getRandomData()
{
Random myR = new Random(1);
SeriesCollection SC = new SeriesCollection();
for (int a = 0; a < yLabels.Length; a++)
{
Series s = new Series("Series " + a.ToString());
for (int b = 0; b < xLabels.Length; b++)
{
Element e = new Element(xLabels[b]);
e.YValue = a;
e.BubbleSize = myR.Next(50);
s.Elements.Add(e);
}
SC.Add(s);
}
return SC;
}
SeriesCollection getLiveData()
{
DataEngine de = new DataEngine(ConfigurationManager.AppSettings["DNCConnectionString"]);
de.ChartObject = Chart; // Necessary to view any errors the dataEngine may throw.
de.SqlStatement = "SELECT XAxisColumn, YAxisColumn FROM ....";
return de.GetSeries();
}
</script>
<html xmlns="http://www.w3.org/1999/xhtml">
<head>
<title>.netCHARTING Sample</title>
</head>
<body>
<div align="center">
<dnc:Chart ID="Chart" runat="server" />
</div>
</body>
</html>
<%@ Page Language="vb" Description="dotnetCHARTING Component" %>
<%@ Register TagPrefix="dnc" Namespace="dotnetCHARTING" Assembly="dotnetCHARTING" %>
<%@ Import Namespace="System.Drawing" %>
<%@ Import Namespace="System.Drawing.Drawing2D" %>
<%@ Import Namespace="dotnetCHARTING.Mapping" %>
<script runat="server">
Dim yLabels As String() = New String() { "A", "B", "C", "D", "E", "F", "G" }
Dim xLabels As String() = New String() { "A", "B", "C", "D", "E", "F", "G", "H", "I", "J" }
Sub Page_Load(ByVal sender As Object, ByVal e As EventArgs)
' Demonstrates how to create a HeatMap grid using the combo chart type and element markers.
Chart.Size = "420x330"
Chart.TempDirectory = "temp"
Chart.Debug = True
Chart.LegendBox.Visible = False
Chart.MarginTop = 25
' The chart will use large sqare markers for elements.
Chart.DefaultSeries.Type = SeriesType.Marker
Chart.DefaultElement.Marker.Type = ElementMarkerType.Square
Chart.DefaultElement.Marker.Size = 38
' Set the y scale to show only the markers.
Chart.YAxis.Minimum = -.5
Chart.YAxis.Maximum = yLabels.Length -.45
Chart.DefaultElement.ToolTip = "Value: %BubbleSize"
' *DYNAMIC DATA NOTE*
' This sample uses random data to populate the chart. To populate
' a chart with database data see the following resources:
' - Use the getLiveData() method using the dataEngine to query a database.
' - Help File > Getting Started > Data Tutorials
' - DataEngine Class in the help file
' - Sample: features/DataEngine.aspx
Dim mySC As SeriesCollection = getRandomData()
' Add the random data.
Chart.SeriesCollection.Add(mySC)
Chart.YAxis.ClearValues = True
For i As Integer = 0 To yLabels.Length - 1
Chart.YAxis.ExtraTicks.Add(New AxisTick(i, yLabels(i)))
Next i
Chart.SmartPalette.Add("*", New SmartColor(Color.Yellow, Color.Red, New ScaleRange(0, 50), ElementValue.BubbleSize))
Dim an As Annotation = New Annotation(getSwatch(300, Chart.SmartPalette, 10, True))
an.ClearColors()
'an.Line.Color = Color.Black;
an.Position = New Point(7, 5)
an.Size = New Size(420, 20)
Chart.Annotations.Add(an)
End Sub
Function getSwatch(ByVal width As Integer, ByVal sp As SmartPalette, ByVal divisions As Integer, ByVal withValues As Boolean) As String
' Get Maximum Value of the smart palette range
Dim max As Double = CDbl(sp.GetScaleRange("*").ValueHigh)
Dim swatch As String = "", spacers As String = ""
' Width of each division.
Dim boxWidth As Integer = width / divisions
' Generate swatch string for each division.
For i As Integer = 0 To divisions
spacers &= "<Chart:Spacer size='" & boxWidth & "x1'>"
' Get the color of the current division.
Dim color As String = getHTMLColor(sp.GetValueColor("", (i * (max / divisions))))
If withValues Then
swatch &= "<block bgColor='" & color & "' fColor='Black' fStyle='Regular'>" & (i * (max / divisions))
Else
swatch &= "<block bgColor='" & color & "' fColor='" & color & "'>_"
End If
Next i
'return the swatch string.
Return spacers & "<row>" & swatch
End Function
Function getHTMLColor(ByVal c As Color) As String
Return "#" & c.R.ToString("X2") + c.G.ToString("X2") + c.B.ToString("X2")
End Function
Function getRandomData() As SeriesCollection
Dim myR As Random = New Random(1)
Dim SC As SeriesCollection = New SeriesCollection()
For a As Integer = 0 To yLabels.Length - 1
Dim s As Series = New Series("Series " & a.ToString())
For b As Integer = 0 To xLabels.Length - 1
Dim e As Element = New Element(xLabels(b))
e.YValue = a
e.BubbleSize = myR.Next(50)
s.Elements.Add(e)
Next b
SC.Add(s)
Next a
Return SC
End Function
Function getLiveData() As SeriesCollection
Dim de As DataEngine = New DataEngine(ConfigurationManager.AppSettings("DNCConnectionString"))
de.ChartObject = Chart ' Necessary to view any errors the dataEngine may throw.
de.SqlStatement = "SELECT XAxisColumn, YAxisColumn FROM ...."
Return de.GetSeries()
End Function
</script>
<html xmlns="http://www.w3.org/1999/xhtml">
<head>
<title>.netCHARTING Sample</title>
</head>
<body>
<div align="center">
<dnc:Chart ID="Chart" runat="server" />
</div>
</body>
</html>