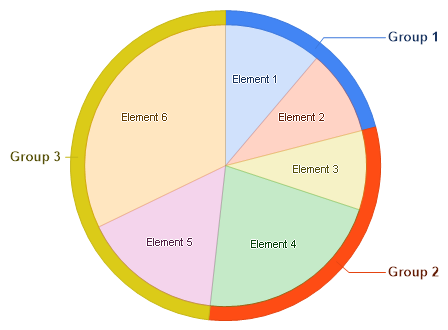
Gallery
Pie Sum Ring
<%@ Page Language="C#" Description="dotnetCHARTING Component" %>
<%@ Register TagPrefix="dotnet" Namespace="dotnetCHARTING" Assembly="dotnetCHARTING" %>
<%@ Import Namespace="System.Drawing" %>
<%@ Import Namespace="System.Drawing.Drawing2D" %>
<%@ Import Namespace="dotnetCHARTING.Mapping" %>
<script runat="server">
void Page_Load(Object sender, EventArgs e)
{
// Demonstrates using a stacked pie ring to indicate which pie elements belong to which series or group.
Chart.TempDirectory = "temp";
Chart.Debug = true;
Chart.Type = ChartType.PiesNested;
Chart.Size = "600x350";
//Chart.Title = ".netCHARTING Sample";
Chart.LegendBox.Visible = false;
Chart.DefaultElement.ShowValue = true;
Chart.DefaultElement.SmartLabel.Text = "%Name";
Chart.DefaultElement.Transparency = 75;
Chart.SpacingPercentageNested = 0;
// *DYNAMIC DATA NOTE*
// This sample uses random data to populate the chart. To populate
// a chart with database data see the following resources:
// - Help File > Getting Started > Data Tutorials
// - DataEngine Class in the help file
// - Sample: features/DataEngine.aspx
SeriesCollection mySC = getRandomData();
Chart.SeriesCollection.Add(getProcessed(mySC));
Chart.YAxis.Scale = Scale.Stacked;
}
SeriesCollection getProcessed(SeriesCollection sc)
{
Series s1 = new Series();
Series s2 = new Series();
int i = 1;
foreach (Series s in sc)
{
s1.Elements.Add(s.Elements);
Element sumE = s.Calculate("Group " + i.ToString(), Calculation.Sum);
s2.Elements.Add(sumE);
i++;
}
s1.DefaultElement.SmartLabel.OutlineColor = Color.White;
s2.DefaultElement.ShowValue = true;
s2.DefaultElement.SmartLabel.Font = new Font("Arial", 10, FontStyle.Bold);
s2.DefaultElement.SmartLabel.Text = "%Name";
s1.DefaultElement.BubbleSize = 50;
s2.DefaultElement.BubbleSize = 5;
s2.DefaultElement.Transparency = 0;
return new SeriesCollection(s2, s1);
}
SeriesCollection getRandomData()
{
Random myR = new Random(5);
SeriesCollection SC = new SeriesCollection();
for (int a = 1; a < 4; a++)
{
Series s = new Series("Series " + a.ToString());
for (int b = 1; b < 3; b++)
{
Element e = new Element("Element " + (b + (a * 2) - 2).ToString());
e.YValue = myR.Next(50);
s.Elements.Add(e);
}
SC.Add(s);
}
return SC;
}
</script>
<html xmlns="http://www.w3.org/1999/xhtml">
<head>
<title>.netCHARTING Sample</title>
</head>
<body>
<div align="center">
<dotnet:Chart ID="Chart" runat="server" />
</div>
</body>
</html>
<%@ Page Language="vb" Description="dotnetCHARTING Component" %>
<%@ Register TagPrefix="dotnet" Namespace="dotnetCHARTING" Assembly="dotnetCHARTING" %>
<%@ Import Namespace="System.Drawing" %>
<%@ Import Namespace="System.Drawing.Drawing2D" %>
<%@ Import Namespace="dotnetCHARTING.Mapping" %>
<script runat="server">
Sub Page_Load(ByVal sender As Object, ByVal e As EventArgs)
' Demonstrates using a stacked pie ring to indicate which pie elements belong to which series or group.
Chart.TempDirectory = "temp"
Chart.Debug = True
Chart.Type = ChartType.PiesNested
Chart.Size = "600x350"
'Chart.Title = ".netCHARTING Sample";
Chart.LegendBox.Visible = False
Chart.DefaultElement.ShowValue = True
Chart.DefaultElement.SmartLabel.Text = "%Name"
Chart.DefaultElement.Transparency = 75
Chart.SpacingPercentageNested = 0
' *DYNAMIC DATA NOTE*
' This sample uses random data to populate the chart. To populate
' a chart with database data see the following resources:
' - Help File > Getting Started > Data Tutorials
' - DataEngine Class in the help file
' - Sample: features/DataEngine.aspx
Dim mySC As SeriesCollection = getRandomData()
Chart.SeriesCollection.Add(getProcessed(mySC))
Chart.YAxis.Scale = Scale.Stacked
End Sub
Function getProcessed(ByVal sc As SeriesCollection) As SeriesCollection
Dim s1 As Series = New Series()
Dim s2 As Series = New Series()
Dim i As Integer = 1
For Each s As Series In sc
s1.Elements.Add(s.Elements)
Dim sumE As Element = s.Calculate("Group " & i.ToString(), Calculation.Sum)
s2.Elements.Add(sumE)
i += 1
Next s
s1.DefaultElement.SmartLabel.OutlineColor = Color.White
s2.DefaultElement.ShowValue = True
s2.DefaultElement.SmartLabel.Font = New Font("Arial", 10, FontStyle.Bold)
s2.DefaultElement.SmartLabel.Text = "%Name"
s1.DefaultElement.BubbleSize = 50
s2.DefaultElement.BubbleSize = 5
s2.DefaultElement.Transparency = 0
Return New SeriesCollection(s2, s1)
End Function
Function getRandomData() As SeriesCollection
Dim myR As Random = New Random(5)
Dim SC As SeriesCollection = New SeriesCollection()
For a As Integer = 1 To 3
Dim s As Series = New Series("Series " & a.ToString())
For b As Integer = 1 To 2
Dim e As Element = New Element("Element " & (b + (a * 2) - 2).ToString())
e.YValue = myR.Next(50)
s.Elements.Add(e)
Next b
SC.Add(s)
Next a
Return SC
End Function
</script>
<html xmlns="http://www.w3.org/1999/xhtml">
<head>
<title>.netCHARTING Sample</title>
</head>
<body>
<div align="center">
<dotnet:Chart ID="Chart" runat="server" />
</div>
</body>
</html>
- Sample FilenamePieSumRing.aspx
- Version4.3
- Uses DatabaseNo