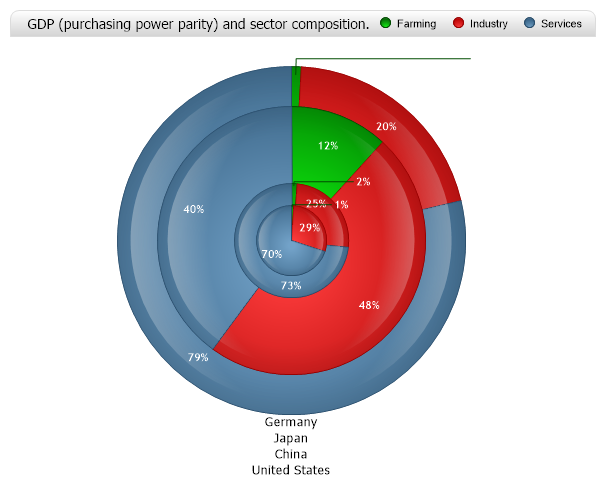
Gallery
GDPBubble Pie
<%@ Page Language="C#" Description="dotnetCHARTING Component" %>
<%@ Register TagPrefix="dotnet" Namespace="dotnetCHARTING" Assembly="dotnetCHARTING" %>
<%@ Import Namespace="System.Drawing" %>
<html xmlns="http://www.w3.org/1999/xhtml">
<head>
<title>Element Markers</title>
<script runat="server">
void Page_Load(Object sender, EventArgs e)
{
// Demonstrates stacked pies using DefaultElement.BubbleSize to control the pie sizes.
Chart.Title = " GDP (purchasing power parity) and sector composition.";
Chart.Type = ChartType.PiesNested;
Chart.YAxis.Scale = Scale.Normal;
Chart.Width = 600;
Chart.Height = 500;
Chart.TempDirectory = "temp";
Chart.Debug = true;
Chart.Palette = new Color[] { Color.Green, Color.Red, Color.SteelBlue };
Chart.LegendBox.Template = "%Icon%Name";
Chart.DefaultSeries.DefaultElement.LegendEntry.SeriesType = SeriesType.Marker;
Chart.DefaultSeries.DefaultElement.LegendEntry.Marker.Size = 10;
// TitleBox Customization
Chart.TitleBox.Position = TitleBoxPosition.FullWithLegend;
Chart.TitleBox.Background = new Background(Color.White, Color.LightGray, 90);
Chart.TitleBox.CornerTopLeft = BoxCorner.Round;
Chart.TitleBox.CornerTopRight = BoxCorner.Round;
Chart.TitleBox.Label.Color = Color.Black;
Chart.ShadingEffectMode = ShadingEffectMode.Three;
Chart.DefaultSeries.DefaultElement.ShowValue = true;
Chart.DefaultSeries.DefaultElement.SmartLabel.Color = Color.White;
Chart.DefaultSeries.DefaultElement.SmartLabel.Font = new Font("Trebuchet MS", 8.5f, FontStyle.Bold);
Chart.Series.Name = "United States";
Chart.Series.DefaultElement.BubbleSize = 12980;
Chart.Series.Element.Name = "Farming";
Chart.Series.Element.YValue = 0.9;
Chart.Series.Elements.Add();
Chart.Series.Element.Name = "Industry";
Chart.Series.Element.YValue = 20.4;
Chart.Series.Elements.Add();
Chart.Series.Element.Name = "Services";
Chart.Series.Element.YValue = 78.6;
Chart.Series.Elements.Add();
Chart.SeriesCollection.Add();
Chart.Series.Name = "China";
Chart.Series.DefaultElement.BubbleSize = 10000;
Chart.Series.Element.Name = "Farming";
Chart.Series.Element.YValue = 11.9;
Chart.Series.Elements.Add();
Chart.Series.Element.Name = "Industry";
Chart.Series.Element.YValue = 48.1;
Chart.Series.Elements.Add();
Chart.Series.Element.Name = "Services";
Chart.Series.Element.YValue = 40;
Chart.Series.Elements.Add();
Chart.SeriesCollection.Add();
Chart.Series.Name = "Japan";
Chart.Series.DefaultElement.BubbleSize = 4220;
Chart.Series.Element.Name = "Farming";
Chart.Series.Element.YValue = 1.6;
Chart.Series.Elements.Add();
Chart.Series.Element.Name = "Industry";
Chart.Series.Element.YValue = 25.3;
Chart.Series.Elements.Add();
Chart.Series.Element.Name = "Services";
Chart.Series.Element.YValue = 73.1;
Chart.Series.Elements.Add();
Chart.SeriesCollection.Add();
Chart.Series.Name = "Germany";
Chart.Series.DefaultElement.BubbleSize = 2585;
Chart.Series.Element.Name = "Farming";
Chart.Series.Element.YValue = 1.0;
Chart.Series.Elements.Add();
Chart.Series.Element.Name = "Industry";
Chart.Series.Element.YValue = 29.1;
Chart.Series.Elements.Add();
Chart.Series.Element.Name = "Services";
Chart.Series.Element.YValue = 70;
Chart.Series.Elements.Add();
Chart.SeriesCollection.Add();
}
</script>
</head>
<body>
<br>
<div style="text-align: center">
<dotnet:Chart ID="Chart" runat="server">
</dotnet:Chart>
</div>
</body>
</html>
<%@ Page Language="vb" Description="dotnetCHARTING Component" %>
<%@ Register TagPrefix="dotnet" Namespace="dotnetCHARTING" Assembly="dotnetCHARTING" %>
<%@ Import Namespace="System.Drawing" %>
<html xmlns="http://www.w3.org/1999/xhtml">
<head>
<title>Element Markers</title>
<script runat="server">
Sub Page_Load(ByVal sender As Object, ByVal e As EventArgs)
' Demonstrates stacked pies using DefaultElement.BubbleSize to control the pie sizes.
Chart.Title = " GDP (purchasing power parity) and sector composition."
Chart.Type = ChartType.PiesNested
Chart.YAxis.Scale = Scale.Normal
Chart.Width = 600
Chart.Height = 500
Chart.TempDirectory = "temp"
Chart.Debug = True
Chart.Palette = New Color() { Color.Green, Color.Red, Color.SteelBlue }
Chart.LegendBox.Template = "%Icon%Name"
Chart.DefaultSeries.DefaultElement.LegendEntry.SeriesType = SeriesType.Marker
Chart.DefaultSeries.DefaultElement.LegendEntry.Marker.Size = 10
' TitleBox Customization
Chart.TitleBox.Position = TitleBoxPosition.FullWithLegend
Chart.TitleBox.Background = New Background(Color.White, Color.LightGray, 90)
Chart.TitleBox.CornerTopLeft = BoxCorner.Round
Chart.TitleBox.CornerTopRight = BoxCorner.Round
Chart.TitleBox.Label.Color = Color.Black
Chart.ShadingEffectMode = ShadingEffectMode.Three
Chart.DefaultSeries.DefaultElement.ShowValue = True
Chart.DefaultSeries.DefaultElement.SmartLabel.Color = Color.White
Chart.DefaultSeries.DefaultElement.SmartLabel.Font = New Font("Trebuchet MS", 8.5f, FontStyle.Bold)
Chart.Series.Name = "United States"
Chart.Series.DefaultElement.BubbleSize = 12980
Chart.Series.Element.Name = "Farming"
Chart.Series.Element.YValue = 0.9
Chart.Series.Elements.Add()
Chart.Series.Element.Name = "Industry"
Chart.Series.Element.YValue = 20.4
Chart.Series.Elements.Add()
Chart.Series.Element.Name = "Services"
Chart.Series.Element.YValue = 78.6
Chart.Series.Elements.Add()
Chart.SeriesCollection.Add()
Chart.Series.Name = "China"
Chart.Series.DefaultElement.BubbleSize = 10000
Chart.Series.Element.Name = "Farming"
Chart.Series.Element.YValue = 11.9
Chart.Series.Elements.Add()
Chart.Series.Element.Name = "Industry"
Chart.Series.Element.YValue = 48.1
Chart.Series.Elements.Add()
Chart.Series.Element.Name = "Services"
Chart.Series.Element.YValue = 40
Chart.Series.Elements.Add()
Chart.SeriesCollection.Add()
Chart.Series.Name = "Japan"
Chart.Series.DefaultElement.BubbleSize = 4220
Chart.Series.Element.Name = "Farming"
Chart.Series.Element.YValue = 1.6
Chart.Series.Elements.Add()
Chart.Series.Element.Name = "Industry"
Chart.Series.Element.YValue = 25.3
Chart.Series.Elements.Add()
Chart.Series.Element.Name = "Services"
Chart.Series.Element.YValue = 73.1
Chart.Series.Elements.Add()
Chart.SeriesCollection.Add()
Chart.Series.Name = "Germany"
Chart.Series.DefaultElement.BubbleSize = 2585
Chart.Series.Element.Name = "Farming"
Chart.Series.Element.YValue = 1.0
Chart.Series.Elements.Add()
Chart.Series.Element.Name = "Industry"
Chart.Series.Element.YValue = 29.1
Chart.Series.Elements.Add()
Chart.Series.Element.Name = "Services"
Chart.Series.Element.YValue = 70
Chart.Series.Elements.Add()
Chart.SeriesCollection.Add()
End Sub
</script>
</head>
<body>
<br>
<div style="text-align: center">
<dotnet:Chart ID="Chart" runat="server">
</dotnet:Chart>
</div>
</body>
</html>
- Sample FilenameGDPBubblePie.aspx
- Version4.3
- Uses DatabaseNo