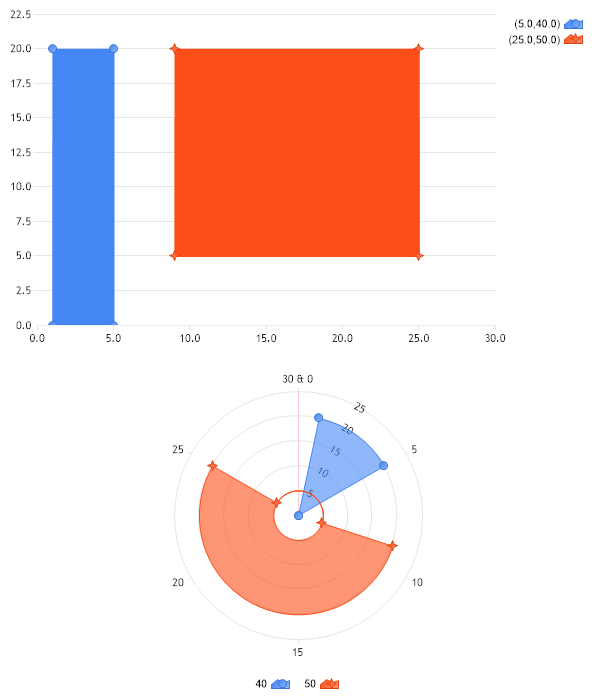
Gallery
Odd Shape Columns
<%@ Page Language="C#" Description="dotnetCHARTING Component" %>
<%@ Register TagPrefix="dotnet" Namespace="dotnetCHARTING" Assembly="dotnetCHARTING"%>
<%@ Import Namespace="System.Drawing" %>
<%@ Import Namespace="System.Drawing.Drawing2D" %>
<script runat="server">
void Page_Load(Object sender,EventArgs e)
{
SetChart(Chart);
SetChart(Chart1);
Chart1.Type = ChartType.Radar;
Chart1.LegendBox.Position = LegendBoxPosition.BottomMiddle;
// Demonstrates using AreaLine series to draw arbitrary rectangles anywhere on a chart. These can be used as 2D axis markers or elements to display data.
}
void SetChart(Chart c)
{
c.TempDirectory = "temp";
c.Debug = true;
c.Type = ChartType.Combo;
c.Size = "600x350";
//c.Title = ".netCHARTING Sample";
c.DefaultSeries.Type = SeriesType.AreaLine;
// This will ensure the x axis is numeric despite elements having names.
c.XAxis.Scale = Scale.Normal;
// *DYNAMIC DATA NOTE*
// This sample uses random data to populate the chart. To populate
// a chart with database data see the following resources:
// - Help File > Getting Started > Data Tutorials
// - DataEngine Class in the help file
// - Sample: features/DataEngine.aspx
Series s = Series.FromYValues(0,20,20,0);
s[0].XValue = .99;
s[1].XValue = 1;
s[2].XValue = 5;
s[3].XValue = 5.01;
c.SeriesCollection.Add(s);
Series s2 = Series.FromYValues(5,20,20,5);
s2[0].XValue = 8.99;
s2[1].XValue = 9;
s2[2].XValue = 25;
s2[3].XValue = 25.01;
s2[0].YValueStart = 5;
s2[1].YValueStart = 5;
s2[2].YValueStart = 5;
s2[3].YValueStart = 5;
c.SeriesCollection.Add(s2);
}
</script>
<html xmlns="http://www.w3.org/1999/xhtml">
<head>
<title>.netCHARTING Sample</title> </head>
<body>
<div align="center">
<dotnet:Chart id="Chart" runat="server"/>
<dotnet:Chart id="Chart1" runat="server"/>
</div>
</body>
</html>
<%@ Page Language="vb" Description="dotnetCHARTING Component" %>
<%@ Register TagPrefix="dotnet" Namespace="dotnetCHARTING" Assembly="dotnetCHARTING"%>
<%@ Import Namespace="System.Drawing" %>
<%@ Import Namespace="System.Drawing.Drawing2D" %>
<script runat="server">
Sub Page_Load(ByVal sender As Object, ByVal e As EventArgs)
SetChart_Renamed(Chart)
SetChart_Renamed(Chart1)
Chart1.Type = ChartType.Radar
Chart1.LegendBox.Position = LegendBoxPosition.BottomMiddle
' Demonstrates using AreaLine series to draw arbitrary rectangles anywhere on a chart. These can be used as 2D axis markers or elements to display data.
End Sub
Sub SetChart_Renamed(ByVal c As Chart)
c.TempDirectory = "temp"
c.Debug = True
c.Type = ChartType.Combo
c.Size = "600x350"
'c.Title = ".netCHARTING Sample";
c.DefaultSeries.Type = SeriesType.AreaLine
' This will ensure the x axis is numeric despite elements having names.
c.XAxis.Scale = Scale.Normal
' *DYNAMIC DATA NOTE*
' This sample uses random data to populate the chart. To populate
' a chart with database data see the following resources:
' - Help File > Getting Started > Data Tutorials
' - DataEngine Class in the help file
' - Sample: features/DataEngine.aspx
Dim s As Series = Series.FromYValues(0,20,20,0)
s(0).XValue =.99
s(1).XValue = 1
s(2).XValue = 5
s(3).XValue = 5.01
c.SeriesCollection.Add(s)
Dim s2 As Series = Series.FromYValues(5,20,20,5)
s2(0).XValue = 8.99
s2(1).XValue = 9
s2(2).XValue = 25
s2(3).XValue = 25.01
s2(0).YValueStart = 5
s2(1).YValueStart = 5
s2(2).YValueStart = 5
s2(3).YValueStart = 5
c.SeriesCollection.Add(s2)
End Sub
</script>
<html xmlns="http://www.w3.org/1999/xhtml">
<head>
<title>.netCHARTING Sample</title> </head>
<body>
<div align="center">
<dotnet:Chart id="Chart" runat="server"/>
<dotnet:Chart id="Chart1" runat="server"/>
</div>
</body>
</html>
- Sample FilenameOddShapeColumns.aspx
- Version4.1
- Uses DatabaseNo