Gallery
Limit
<%@ Page Language="C#" Description="dotnetCHARTING Component"%>
<%@ Register TagPrefix="dotnet" Namespace="dotnetCHARTING" Assembly="dotnetCHARTING"%>
<%@ Import Namespace="System.Drawing" %>
<script runat="server">
void Page_Load(Object sender,EventArgs e)
{
//set global properties
Chart.Title="Sales";
Chart.ChartArea.YAxis.Label.Text="Sales";
Chart.ChartArea.YAxis.FormatString="Currency";
Chart.TempDirectory="temp";
Chart.Debug=true;
Chart.DefaultSeries.DefaultElement.Transparency=15;
Chart.Use3D=true;
Chart.TitleBox.Position = TitleBoxPosition.FullWithLegend;
//Add a series
Chart.Series.ConnectionString = ConfigurationManager.AppSettings["DNCConnectionString"];
Chart.Series.StartDate=new System.DateTime(2022,1,1,0,0,0);
Chart.Series.EndDate = new System.DateTime(2022,12,31,23,59,59);
Chart.Series.Name="Sales";
Chart.Series.SqlStatement= @"SELECT Name,Sum(Total) FROM Orders WHERE OrderDate >= #STARTDATE# AND OrderDate <= #ENDDATE# GROUP BY Orders.Name";
Chart.SeriesCollection.Add();
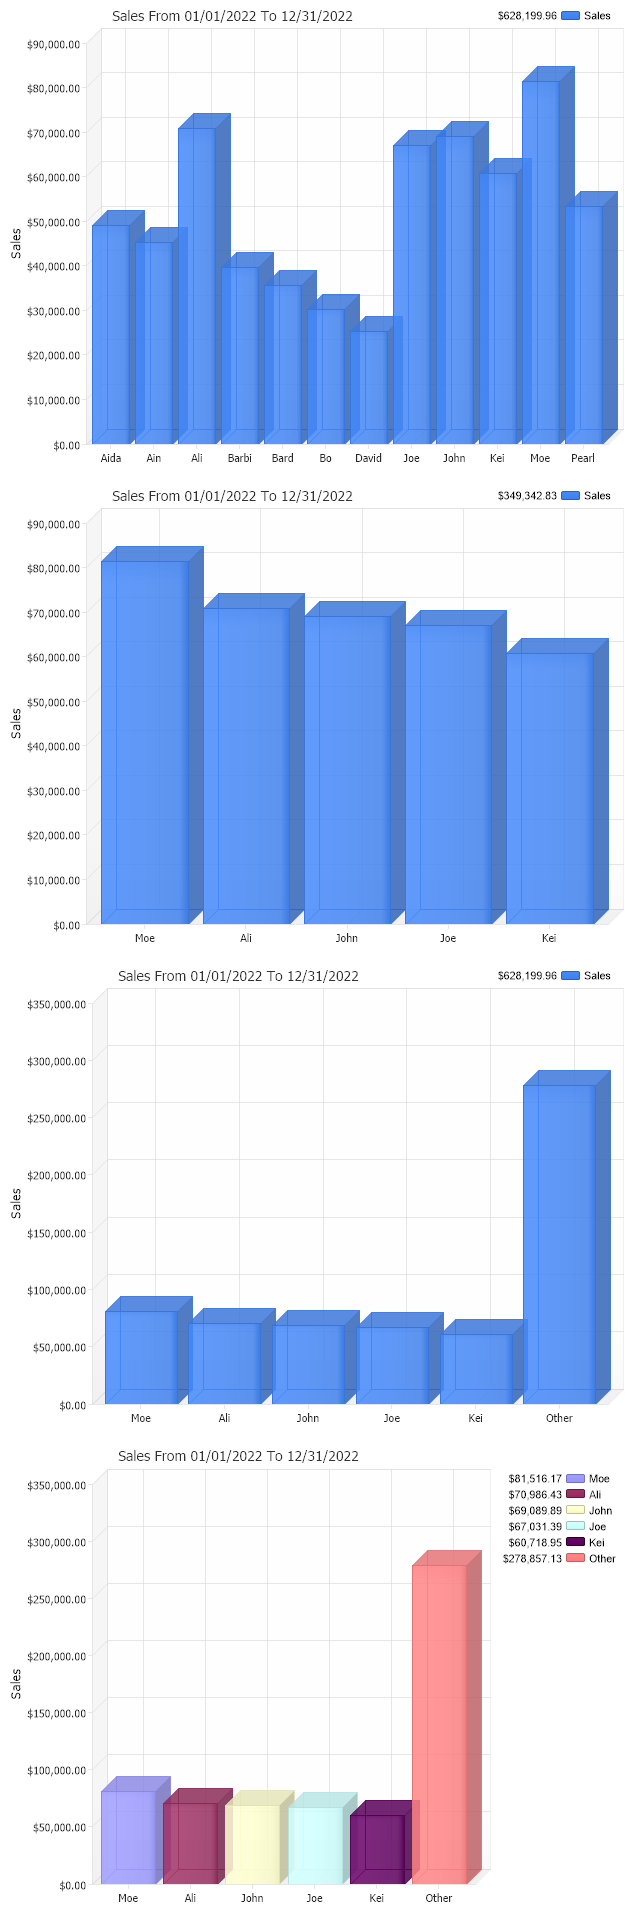
//This is the same chart with limit set to limit the return to the
//Five customers who had the highest purchase totals.
//set global properties
Chart2.Title="Sales";
Chart2.ChartArea.YAxis.Label.Text="Sales";
Chart2.ChartArea.YAxis.FormatString="Currency";
Chart2.TempDirectory="temp";
Chart2.Debug=true;
Chart2.DefaultSeries.DefaultElement.Transparency=15;
Chart2.Use3D=true;
Chart2.TitleBox.Position = TitleBoxPosition.FullWithLegend;
//Add a series
Chart2.Series.ConnectionString = ConfigurationManager.AppSettings["DNCConnectionString"];
Chart2.Series.StartDate=new System.DateTime(2022,1,1,0,0,0);
Chart2.Series.EndDate = new System.DateTime(2022,12,31,23,59,59);
Chart2.Series.Name="Sales";
Chart2.Series.SqlStatement= @"SELECT Name,Sum(Total) FROM Orders WHERE OrderDate >= #STARTDATE# AND OrderDate <= #ENDDATE# GROUP BY Orders.Name ORDER BY Sum(Total)";
Chart2.Series.Limit = "5";
Chart2.SeriesCollection.Add();
//This is the same chart with the ShowOther property set
//this will add an element representing the total sales
//for other customers not in the top five.
//set global properties
Chart3.Title="Sales";
Chart3.ChartArea.YAxis.Label.Text="Sales";
Chart3.ChartArea.YAxis.FormatString="Currency";
Chart3.TempDirectory="temp";
Chart3.Debug=true;
Chart3.DefaultSeries.DefaultElement.Transparency=15;
Chart3.Use3D=true;
Chart3.TitleBox.Position = TitleBoxPosition.FullWithLegend;
//Add a series
Chart3.Series.ConnectionString = ConfigurationManager.AppSettings["DNCConnectionString"];
Chart3.Series.StartDate=new System.DateTime(2022,1,1,0,0,0);
Chart3.Series.EndDate = new System.DateTime(2022,12,31,23,59,59);
Chart3.Series.Name="Sales";
Chart3.Series.SqlStatement= @"SELECT Name,Sum(Total) FROM Orders WHERE OrderDate >= #STARTDATE# AND OrderDate <= #ENDDATE# GROUP BY Orders.Name ORDER BY Sum(Total)";
Chart3.Series.Limit = "5";
Chart3.Series.ShowOther = true;
Chart3.SeriesCollection.Add();
//This is the same chart with the Series level PaletteName
//property set. This will assign a color to each element
//automatically and also create legend entries for the elements.
//This property is most useful when you only have 1 series.
//set global properties
Chart4.Title="Sales";
Chart4.ChartArea.YAxis.Label.Text="Sales";
Chart4.ChartArea.YAxis.FormatString="Currency";
Chart4.TempDirectory="temp";
Chart4.Debug=true;
Chart4.DefaultSeries.DefaultElement.Transparency=15;
Chart4.Use3D=true;
//Add a series
Chart4.Series.ConnectionString = ConfigurationManager.AppSettings["DNCConnectionString"];
Chart4.Series.StartDate=new System.DateTime(2022,1,1,0,0,0);
Chart4.Series.EndDate = new System.DateTime(2022,12,31,23,59,59);
Chart4.Series.Name="Sales";
Chart4.Series.SqlStatement= @"SELECT Name,Sum(Total) FROM Orders WHERE OrderDate >= #STARTDATE# AND OrderDate <= #ENDDATE# GROUP BY Orders.Name ORDER BY Sum(Total)";
Chart4.Series.Limit = "5";
Chart4.Series.ShowOther = true;
Chart4.Series.PaletteName = Palette.One;
Chart4.SeriesCollection.Add();
}
</script>
<html xmlns="http://www.w3.org/1999/xhtml"><head><title>SplitBy and ShowOther Sample</title></head>
<body>
<div style="text-align:center">
<dotnet:Chart id="Chart" runat="server"/>
</div>
<div style="text-align:center">
<dotnet:Chart id="Chart2" runat="server"/>
</div>
<div style="text-align:center">
<dotnet:Chart id="Chart3" runat="server"/>
</div>
<div style="text-align:center">
<dotnet:Chart id="Chart4" runat="server"/>
</div>
</body>
</html>
<%@ Page Language="vb" Description="dotnetCHARTING Component"%>
<%@ Register TagPrefix="dotnet" Namespace="dotnetCHARTING" Assembly="dotnetCHARTING"%>
<%@ Import Namespace="System.Drawing" %>
<script runat="server">
Sub Page_Load(ByVal sender As Object, ByVal e As EventArgs)
'set global properties
Chart.Title="Sales"
Chart.ChartArea.YAxis.Label.Text="Sales"
Chart.ChartArea.YAxis.FormatString="Currency"
Chart.TempDirectory="temp"
Chart.Debug=True
Chart.DefaultSeries.DefaultElement.Transparency=15
Chart.Use3D=True
Chart.TitleBox.Position = TitleBoxPosition.FullWithLegend
'Add a series
Chart.Series.ConnectionString = ConfigurationManager.AppSettings("DNCConnectionString")
Chart.Series.StartDate = New System.DateTime(2022,1,1,0,0,0)
Chart.Series.EndDate = New System.DateTime(2022,12,31,23,59,59)
Chart.Series.Name="Sales"
Chart.Series.SqlStatement= "SELECT Name,Sum(Total) FROM Orders WHERE OrderDate >= #STARTDATE# AND OrderDate <= #ENDDATE# GROUP BY Orders.Name"
Chart.SeriesCollection.Add()
'This is the same chart with limit set to limit the return to the
'Five customers who had the highest purchase totals.
'set global properties
Chart2.Title="Sales"
Chart2.ChartArea.YAxis.Label.Text="Sales"
Chart2.ChartArea.YAxis.FormatString="Currency"
Chart2.TempDirectory="temp"
Chart2.Debug=True
Chart2.DefaultSeries.DefaultElement.Transparency=15
Chart2.Use3D=True
Chart2.TitleBox.Position = TitleBoxPosition.FullWithLegend
'Add a series
Chart2.Series.ConnectionString = ConfigurationManager.AppSettings("DNCConnectionString")
Chart2.Series.StartDate = New System.DateTime(2022,1,1,0,0,0)
Chart2.Series.EndDate = New System.DateTime(2022,12,31,23,59,59)
Chart2.Series.Name="Sales"
Chart2.Series.SqlStatement= "SELECT Name,Sum(Total) FROM Orders WHERE OrderDate >= #STARTDATE# AND OrderDate <= #ENDDATE# GROUP BY Orders.Name ORDER BY Sum(Total)"
Chart2.Series.Limit = "5"
Chart2.SeriesCollection.Add()
'This is the same chart with the ShowOther property set
'this will add an element representing the total sales
'for other customers not in the top five.
'set global properties
Chart3.Title="Sales"
Chart3.ChartArea.YAxis.Label.Text="Sales"
Chart3.ChartArea.YAxis.FormatString="Currency"
Chart3.TempDirectory="temp"
Chart3.Debug=True
Chart3.DefaultSeries.DefaultElement.Transparency=15
Chart3.Use3D=True
Chart3.TitleBox.Position = TitleBoxPosition.FullWithLegend
'Add a series
Chart3.Series.ConnectionString = ConfigurationManager.AppSettings("DNCConnectionString")
Chart3.Series.StartDate = New System.DateTime(2022,1,1,0,0,0)
Chart3.Series.EndDate = New System.DateTime(2022,12,31,23,59,59)
Chart3.Series.Name="Sales"
Chart3.Series.SqlStatement= "SELECT Name,Sum(Total) FROM Orders WHERE OrderDate >= #STARTDATE# AND OrderDate <= #ENDDATE# GROUP BY Orders.Name ORDER BY Sum(Total)"
Chart3.Series.Limit = "5"
Chart3.Series.ShowOther = True
Chart3.SeriesCollection.Add()
'This is the same chart with the Series level PaletteName
'property set. This will assign a color to each element
'automatically and also create legend entries for the elements.
'This property is most useful when you only have 1 series.
'set global properties
Chart4.Title="Sales"
Chart4.ChartArea.YAxis.Label.Text="Sales"
Chart4.ChartArea.YAxis.FormatString="Currency"
Chart4.TempDirectory="temp"
Chart4.Debug=True
Chart4.DefaultSeries.DefaultElement.Transparency=15
Chart4.Use3D=True
'Add a series
Chart4.Series.ConnectionString = ConfigurationManager.AppSettings("DNCConnectionString")
Chart4.Series.StartDate = New System.DateTime(2022,1,1,0,0,0)
Chart4.Series.EndDate = New System.DateTime(2022,12,31,23,59,59)
Chart4.Series.Name="Sales"
Chart4.Series.SqlStatement= "SELECT Name,Sum(Total) FROM Orders WHERE OrderDate >= #STARTDATE# AND OrderDate <= #ENDDATE# GROUP BY Orders.Name ORDER BY Sum(Total)"
Chart4.Series.Limit = "5"
Chart4.Series.ShowOther = True
Chart4.Series.PaletteName = Palette.One
Chart4.SeriesCollection.Add()
End Sub
</script>
<html xmlns="http://www.w3.org/1999/xhtml"><head><title>SplitBy and ShowOther Sample</title></head>
<body>
<div style="text-align:center">
<dotnet:Chart id="Chart" runat="server"/>
</div>
<div style="text-align:center">
<dotnet:Chart id="Chart2" runat="server"/>
</div>
<div style="text-align:center">
<dotnet:Chart id="Chart3" runat="server"/>
</div>
<div style="text-align:center">
<dotnet:Chart id="Chart4" runat="server"/>
</div>
</body>
</html>
- Sample Filenamelimit.aspx
- VersionLegacy (Pre 3.0)
- Uses DatabaseYes