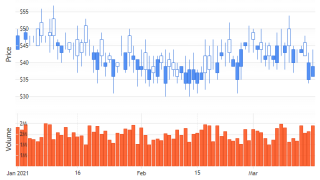
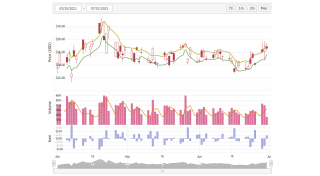
- JS FinanceCSV
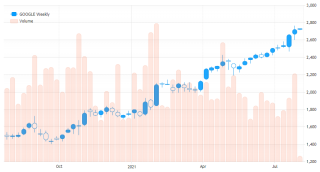
Demonstrates a rounded candlestick chart with volume, zooming, and y axis crosshair.
- JS Candlestick
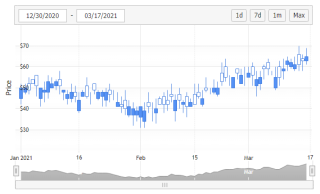
Demonstrates candlestick series type with JSC Navigator.
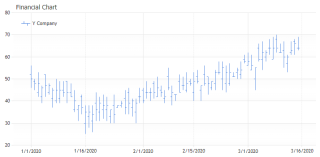
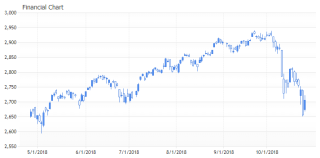
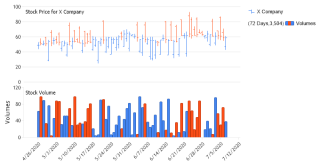
- JS Bars
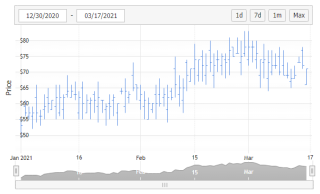
Demonstrates Financial bars with JSC Navigator.
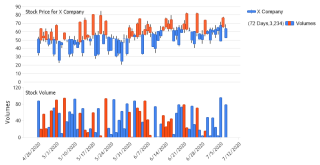
- JS Vol Bars
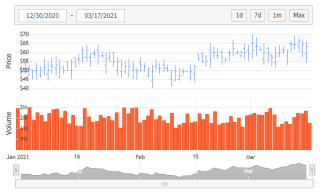
Demonstrates Financial bars and volume chart area with JSC Navigator.
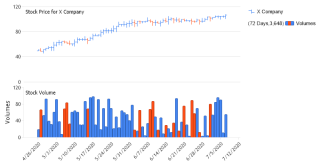
- JS Candlestick Vol
Demonstrates candlestick and volume chart area with JSC Navigator.
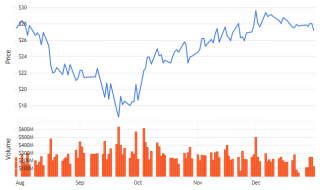
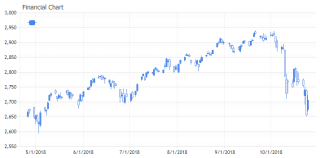
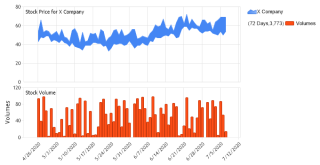
- JS Navigator
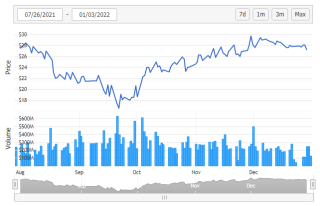
Demonstrates using the JS navigator to show a finance chart with volume.
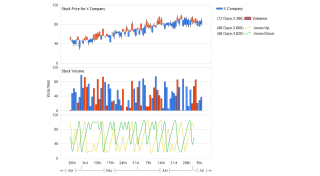
- JS Navigator Aroon
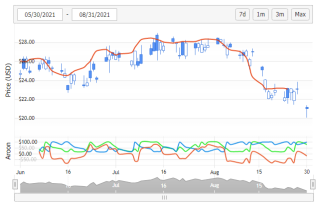
Demonstrates the use of Aroon indicators.
- JS Navigator Chaikin
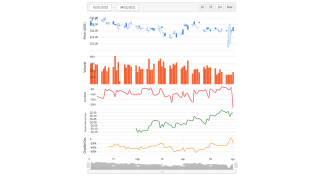
Demonstrates the use of Chaikin indicators with JS Navigator.
- JS NavigatorFinancialMA
Demonstrates the use of the SimpleMovingAverages and GeometricalMovingAverage
- JS NavigatorMultiY
Demonstrates using the JS navigator with multiple axes.chart.
- JS Navigator Plain
Demonstrates using the navigator but without the additional navigator UI elements.
- JS Navigator Toolbar
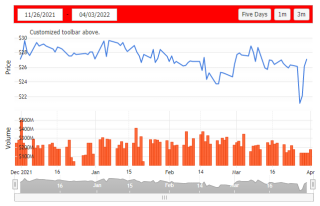
Demonstrates styling the navigation bar with the JS navigator.
- JS Finance Aqua
Demonstrates a finance chart with OHLC series type.
- JS Finance Candle
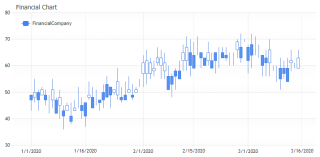
Demonstrates a finance candlestick chart.
- JS FinanceCandleShA
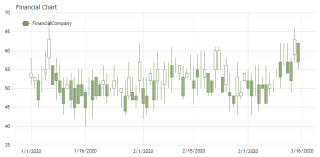
Demonstrates a finance candlestick chart with rounded shading.
- JS FinanceCandleShR
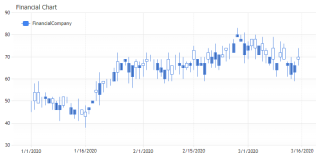
Demonstrates a finance candlestick chart with aqua shading.
- JS Finance Csv Data
Demonstrates a finance candlestick chart.
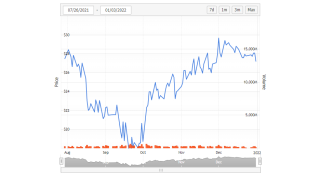
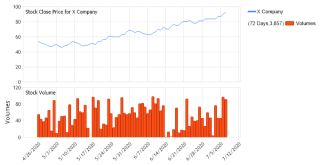
- JS Finance Line
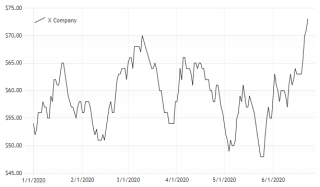
Demonstrates a finance line chart.
- JS Finance Pattern Breaks
Demonstrates a finance candlestick chart
- JS Finance Support Resistance
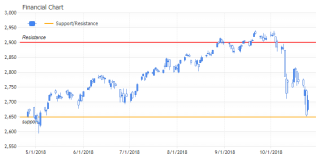
Demonstrates a finance candlestick chart with support/resistance axis markers.
- Candlestick
Financial candlestick.
- Ohlc Bars
OHLC financial bars.
- Hlc Bars
HLC financial bars.
- Close
Closing price line.
- High Low
High-Low area.
- Candlestick Aroon
Candlestick with aroon indicators.