Gallery
<%@ Page Language="C#" Description="dotnetCHARTING Component"%>
<%@ Register TagPrefix="dotnet" Namespace="dotnetCHARTING" Assembly="dotnetCHARTING"%>
<%@ Import Namespace="System.Drawing" %>
<script runat="server">
void Page_Load(Object sender,EventArgs e)
{
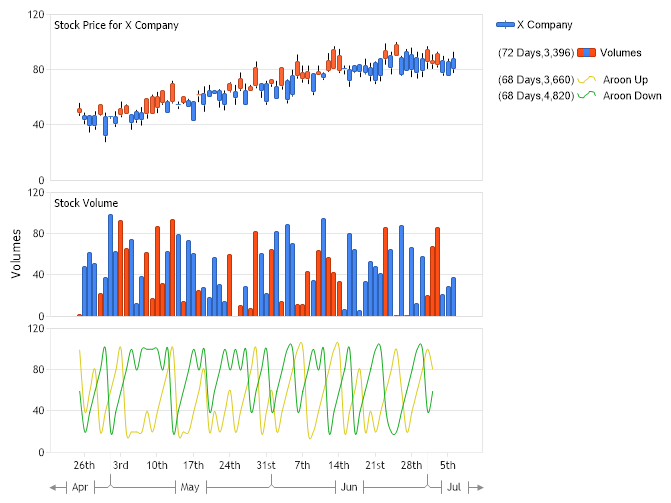
// Demonstrates Financial Candlestick with aroon indicators.
// Set the chart Type
Chart.Type = ChartType.Combo;
// Set the financial chart type
Chart.DefaultSeries.Type = SeriesTypeFinancial.CandleStick;
// Label the chart areas
Chart.ChartArea.Label.Text = "Stock Price for X Company";
// Set the legend template
Chart.LegendBox.Template = "IconName";
// Set the directory where the images will be stored.
Chart.TempDirectory="temp";
// Set the format
Chart.XAxis.FormatString = "d";
// Set the time padding for the x axis.
Chart.XAxis.TimePadding = new TimeSpan(5,0,0,0);
// Set he chart size.
Chart.Width = 700;
Chart.Height = 500;
Chart.DefaultElement.Marker.Visible = false;
Chart.ChartAreaSpacing = 8;
// Modify the x axis labels.
Chart.XAxis.TimeScaleLabels.Mode = TimeScaleLabelMode.Smart;
Chart.XAxis.TimeScaleLabels.DayFormatString = "o";
Chart.XAxis.TimeScaleLabels.RangeIntervals.Add(TimeInterval.Month);
Chart.XAxis.TimeScaleLabels.MonthFormatString = "MMM";
// Add the random data.
SeriesCollection sc = getData();
Chart.SeriesCollection.Add(sc);
Series prices = sc[0];
// Add a volume series to the chart area
Series volumes = new Series("Volumes");
foreach (Element el in prices.Elements)
{
Element newEl = new Element();
newEl.YValue = el.Volume;
newEl.XDateTime = el.XDateTime;
if (el.Close < el.Open)
newEl.Color = Color.FromArgb(254, 76, 20);
else
newEl.Color = Color.FromArgb(66, 133, 244);
volumes.Elements.Add(newEl);
}
// Create the second chart area
ChartArea volumeChartArea = new ChartArea();
volumeChartArea.Label.Text = "Stock Volume";
volumeChartArea.YAxis.Label.Text = "Volumes";
volumeChartArea.HeightPercentage = 30;
volumeChartArea.DefaultElement.ToolTip="%YValue";
Chart.ExtraChartAreas.Add(volumeChartArea);
volumes.Type = SeriesType.Bar;
volumeChartArea.SeriesCollection.Add (volumes);
// Here we create a new chart area for displaying the series for Aroon indicators.
// Aroon chart area
ChartArea aroonChartArea = new ChartArea ();
aroonChartArea.HeightPercentage = 30;
// A new y axis is assigned in order to loose the original y axis' settings.
aroonChartArea.YAxis = new Axis ();
Chart.ExtraChartAreas.Add (aroonChartArea);
// AroonUpOverPeriod - measures the relative time since the last highest high over a peroid of five days.
Series aroonUpOverPeriod = FinancialEngine.AroonUpOverPeriod(prices,5);
aroonUpOverPeriod.Name = " Aroon Up";
aroonUpOverPeriod.Type = SeriesType.Spline;
aroonUpOverPeriod.DefaultElement.Color = Color.FromArgb(219, 203, 24);// Color.FromArgb(49,255,49);
aroonChartArea.SeriesCollection.Add (aroonUpOverPeriod);
// AroonDownOverPeriod - indicator which measures the relative time since the last lowest low over
// a period of five days.
Series aroonDownOverPeriod = FinancialEngine.AroonDownOverPeriod(prices,5);
aroonDownOverPeriod.Name = " Aroon Down";
aroonDownOverPeriod.Type = SeriesType.Spline;
aroonDownOverPeriod.DefaultElement.Color = Color.FromArgb(21, 172, 32);// Color.FromArgb(0,156,255);
aroonChartArea.SeriesCollection.Add (aroonDownOverPeriod);
}
private SeriesCollection getData()
{
SeriesCollection SC = new SeriesCollection();
Random myR = new Random();
for(int i = 1; i < 2; i++)
{
Series s = new Series();
s.Name = "X Company";
double startPrice = 50;
DateTime startDT = new DateTime(2020,4,25);
for(int b = 1; b < 74; b++)
{
Element e = new Element();
e.XDateTime = startDT;
startDT = startDT.AddDays(1);
if(myR.Next(10) > 5)
startPrice += myR.Next(5);
else
startPrice -= myR.Next(3);
e.Close = startPrice;
e.Volume = myR.Next(100);
if(myR.Next(10) > 5)
e.Open = startPrice + myR.Next(16);
else
e.Open = startPrice - myR.Next(16);
if(e.Open > e.Close)
{
e.High = e.Open + myR.Next(6);
e.Low = e.Close - myR.Next(6);
}
else
{
e.High = e.Close + myR.Next(6);
e.Low = e.Open - myR.Next(6);
}
s.Elements.Add(e);
}
SC.Add(s);
}
return(SC);
}
</script>
<html xmlns="http://www.w3.org/1999/xhtml"><head><title>Gallery Sample</title></head>
<body>
<div style="text-align:center">
<dotnet:Chart id="Chart" runat="server"/>
</div>
</body>
</html>
<%@ Page Language="vb" Description="dotnetCHARTING Component"%>
<%@ Register TagPrefix="dotnet" Namespace="dotnetCHARTING" Assembly="dotnetCHARTING"%>
<%@ Import Namespace="System.Drawing" %>
<script runat="server">
Sub Page_Load(ByVal sender As Object, ByVal e As EventArgs)
' Demonstrates Financial Candlestick with aroon indicators.
' Set the chart Type
Chart.Type = ChartType.Combo
' Set the financial chart type
Chart.DefaultSeries.Type = SeriesTypeFinancial.CandleStick
' Label the chart areas
Chart.ChartArea.Label.Text = "Stock Price for X Company"
' Set the legend template
Chart.LegendBox.Template = "IconName"
' Set the directory where the images will be stored.
Chart.TempDirectory="temp"
' Set the format
Chart.XAxis.FormatString = "d"
' Set the time padding for the x axis.
Chart.XAxis.TimePadding = New TimeSpan(5,0,0,0)
' Set he chart size.
Chart.Width = 700
Chart.Height = 500
Chart.DefaultElement.Marker.Visible = False
Chart.ChartAreaSpacing = 8
' Modify the x axis labels.
Chart.XAxis.TimeScaleLabels.Mode = TimeScaleLabelMode.Smart
Chart.XAxis.TimeScaleLabels.DayFormatString = "o"
Chart.XAxis.TimeScaleLabels.RangeIntervals.Add(TimeInterval.Month)
Chart.XAxis.TimeScaleLabels.MonthFormatString = "MMM"
' Add the random data.
Dim sc As SeriesCollection = getData()
Chart.SeriesCollection.Add(sc)
Dim prices As Series = sc(0)
' Add a volume series to the chart area
Dim volumes As Series = New Series("Volumes")
For Each el As Element In prices.Elements
Dim newEl As Element = New Element()
newEl.YValue = el.Volume
newEl.XDateTime = el.XDateTime
If el.Close < el.Open Then
newEl.Color = Color.FromArgb(254, 76, 20)
Else
newEl.Color = Color.FromArgb(66, 133, 244)
End If
volumes.Elements.Add(newEl)
Next el
' Create the second chart area
Dim volumeChartArea As ChartArea = New ChartArea()
volumeChartArea.Label.Text = "Stock Volume"
volumeChartArea.YAxis.Label.Text = "Volumes"
volumeChartArea.HeightPercentage = 30
volumeChartArea.DefaultElement.ToolTip="%YValue"
Chart.ExtraChartAreas.Add(volumeChartArea)
volumes.Type = SeriesType.Bar
volumeChartArea.SeriesCollection.Add (volumes)
' Here we create a new chart area for displaying the series for Aroon indicators.
' Aroon chart area
Dim aroonChartArea As ChartArea = New ChartArea ()
aroonChartArea.HeightPercentage = 30
' A new y axis is assigned in order to loose the original y axis' settings.
aroonChartArea.YAxis = New Axis ()
Chart.ExtraChartAreas.Add (aroonChartArea)
' AroonUpOverPeriod - measures the relative time since the last highest high over a peroid of five days.
Dim aroonUpOverPeriod As Series = FinancialEngine.AroonUpOverPeriod(prices,5)
aroonUpOverPeriod.Name = " Aroon Up"
aroonUpOverPeriod.Type = SeriesType.Spline
aroonUpOverPeriod.DefaultElement.Color = Color.FromArgb(219, 203, 24) ' Color.FromArgb(49,255,49);
aroonChartArea.SeriesCollection.Add (aroonUpOverPeriod)
' AroonDownOverPeriod - indicator which measures the relative time since the last lowest low over
' a period of five days.
Dim aroonDownOverPeriod As Series = FinancialEngine.AroonDownOverPeriod(prices,5)
aroonDownOverPeriod.Name = " Aroon Down"
aroonDownOverPeriod.Type = SeriesType.Spline
aroonDownOverPeriod.DefaultElement.Color = Color.FromArgb(21, 172, 32) ' Color.FromArgb(0,156,255);
aroonChartArea.SeriesCollection.Add (aroonDownOverPeriod)
End Sub
Private Function getData() As SeriesCollection
Dim SC As SeriesCollection = New SeriesCollection()
Dim myR As Random = New Random()
For i As Integer = 1 To 1
Dim s As Series = New Series()
s.Name = "X Company"
Dim startPrice As Double = 50
Dim startDT As DateTime = New DateTime(2020,4,25)
For b As Integer = 1 To 73
Dim e As Element = New Element()
e.XDateTime = startDT
startDT = startDT.AddDays(1)
If myR.Next(10) > 5 Then
startPrice += myR.Next(5)
Else
startPrice -= myR.Next(3)
End If
e.Close = startPrice
e.Volume = myR.Next(100)
If myR.Next(10) > 5 Then
e.Open = startPrice + myR.Next(16)
Else
e.Open = startPrice - myR.Next(16)
End If
If e.Open > e.Close Then
e.High = e.Open + myR.Next(6)
e.Low = e.Close - myR.Next(6)
Else
e.High = e.Close + myR.Next(6)
e.Low = e.Open - myR.Next(6)
End If
s.Elements.Add(e)
Next b
SC.Add(s)
Next i
Return(SC)
End Function
</script>
<html xmlns="http://www.w3.org/1999/xhtml"><head><title>Gallery Sample</title></head>
<body>
<div style="text-align:center">
<dotnet:Chart id="Chart" runat="server"/>
</div>
</body>
</html>
- Sample FilenameGallery/g06.aspx
- VersionLegacy (Pre 3.0)
- Uses DatabaseNo