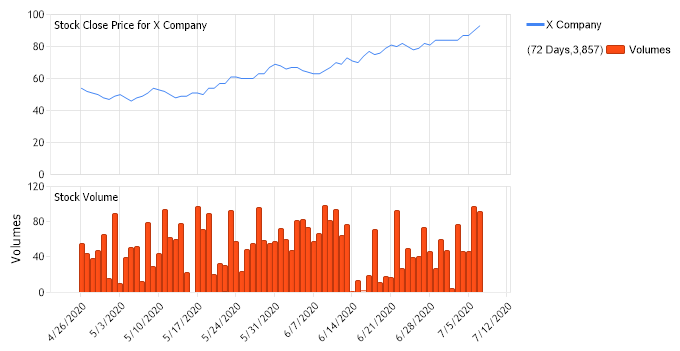
<script runat="server"> void Page_Load(Object sender,EventArgs e) { // Demonstrates Financial Closing price line. // Set the chart Type Chart.Type = ChartType.Combo; // Set the financial chart type Chart.DefaultSeries.Type = SeriesTypeFinancial.Close; Chart.DefaultSeries.Line.Width = 1; // Label the chart areas Chart.ChartArea.Label.Text = "Stock Close Price for X Company";
// Set the legend template Chart.LegendBox.Template = "IconName";
// Set the directory where the images will be stored. Chart.TempDirectory="temp";
// Set the format Chart.XAxis.FormatString = "d";
// Set the time padding for the x axis. Chart.XAxis.TimePadding = new TimeSpan(5,0,0,0);
// Set he chart size. Chart.Width = 700; Chart.Height = 350;
// Add the random data. SeriesCollection sc = getData(); Chart.SeriesCollection.Add(sc);
// Add a volume series to the chart area Series volumes = new Series("Volumes"); volumes.Type = SeriesType.Bar; foreach (Element el in sc[0].Elements) { Element newEl = new Element(); newEl.YValue = el.Volume; newEl.XDateTime = el.XDateTime; volumes.Elements.Add(newEl); } // Create the second chart area ChartArea volumeChartArea = new ChartArea(); volumeChartArea.Label.Text = "Stock Volume"; volumeChartArea.YAxis.Label.Text = "Volumes"; volumeChartArea.HeightPercentage = 40; volumeChartArea.DefaultElement.ToolTip="%YValue"; volumeChartArea.YAxis.DefaultTick.GridLine.Color = Color.Empty; Chart.ExtraChartAreas.Add(volumeChartArea); volumeChartArea.SeriesCollection.Add(volumes); } private SeriesCollection getData() { SeriesCollection SC = new SeriesCollection(); Random myR = new Random(4); for(int i = 1; i < 2; i++) { Series s = new Series(); s.Name = "X Company"; double startPrice = 50;
DateTime startDT = new DateTime(2020,4,26); for(int b = 1; b < 74; b++) { Element e = new Element(); e.XDateTime = startDT; startDT = startDT.AddDays(1);
<script runat="server"> Sub Page_Load(ByVal sender As Object, ByVal e As EventArgs) ' Demonstrates Financial Closing price line. ' Set the chart Type Chart.Type = ChartType.Combo ' Set the financial chart type Chart.DefaultSeries.Type = SeriesTypeFinancial.Close Chart.DefaultSeries.Line.Width = 1 ' Label the chart areas Chart.ChartArea.Label.Text = "Stock Close Price for X Company"
' Set the legend template Chart.LegendBox.Template = "IconName"
' Set the directory where the images will be stored. Chart.TempDirectory="temp"
' Set the format Chart.XAxis.FormatString = "d"
' Set the time padding for the x axis. Chart.XAxis.TimePadding = New TimeSpan(5,0,0,0)
' Set he chart size. Chart.Width = 700 Chart.Height = 350
' Add the random data. Dim sc As SeriesCollection = getData() Chart.SeriesCollection.Add(sc)
' Add a volume series to the chart area Dim volumes As Series = New Series("Volumes") volumes.Type = SeriesType.Bar For Each el As Element In sc(0).Elements Dim newEl As Element = New Element() newEl.YValue = el.Volume newEl.XDateTime = el.XDateTime volumes.Elements.Add(newEl) Next el ' Create the second chart area Dim volumeChartArea As ChartArea = New ChartArea() volumeChartArea.Label.Text = "Stock Volume" volumeChartArea.YAxis.Label.Text = "Volumes" volumeChartArea.HeightPercentage = 40 volumeChartArea.DefaultElement.ToolTip="%YValue" volumeChartArea.YAxis.DefaultTick.GridLine.Color = Color.Empty Chart.ExtraChartAreas.Add(volumeChartArea) volumeChartArea.SeriesCollection.Add(volumes) End Sub Private Function getData() As SeriesCollection Dim SC As SeriesCollection = New SeriesCollection() Dim myR As Random = New Random(4) For i As Integer = 1 To 1 Dim s As Series = New Series() s.Name = "X Company" Dim startPrice As Double = 50
Dim startDT As DateTime = New DateTime(2020,4,26) For b As Integer = 1 To 73 Dim e As Element = New Element() e.XDateTime = startDT startDT = startDT.AddDays(1)
If myR.Next(10) > 5 Then startPrice += myR.Next(5) Else startPrice -= myR.Next(3) End If
e.Close = startPrice
e.Volume = myR.Next(100)
If e.Open > e.Close Then e.High = e.Open + myR.Next(6) e.Low = e.Close - myR.Next(6) Else e.High = e.Close + myR.Next(6) e.Low = e.Open - myR.Next(6) End If s.Elements.Add(e) Next b SC.Add(s) Next i Return(SC)
End Function </script> <html xmlns="http://www.w3.org/1999/xhtml"><head><title>Gallery Sample</title></head> <body> <div style="text-align:center"> <dotnet:Chart id="Chart" runat="server"/> </div> </body> </html>