Gallery
Element Annotation
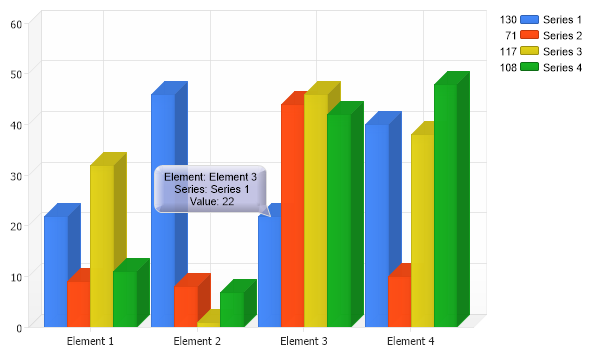
Demonstrates how to attach an annotation to an element on the chart.
- Sample FilenameElementAnnotation.aspx
- VersionLegacy (Pre 3.0)
- Uses DatabaseNo