// *DYNAMIC DATA NOTE* // This sample uses random data to populate the chart. To populate // a chart with database data see the following resources: // - Use the getLiveData() method using the dataEngine to query a database. // - Help File > Getting Started > Data Tutorials // - DataEngine Class in the help file // - Sample: features/DataEngine.aspx
// Add the random data. Chart.SeriesCollection.Add(mySC); }
SeriesCollection getRandomData() { Random myR = new Random(2); SeriesCollection SC = new SeriesCollection(); int a = 0; int b = 0; for (a = 1; a < 2; a++) { Series s = new Series(); for (b = 1; b < 6; b++) { Element e = new Element(); e.YValue = 20; e.YValueStart = 19.5d; s.Elements.Add(e);
if (b > 1) { int val = myR.Next(40); e.SubValues.Add(SubValue.FromValue(val)); e.SubValues.Add(SubValue.FromValue(val)); e.SubValues[1].Type = SubValueType.Marker; } } SC.Add(s); } return SC; }
SeriesCollection getLiveData() { DataEngine de = new DataEngine("ConnectionString goes here"); de.ChartObject = Chart; // Necessary to view any errors the dataEngine may throw. de.SqlStatement = "SELECT XAxisColumn, YAxisColumn FROM ...."; return de.GetSeries(); }
' *DYNAMIC DATA NOTE* ' This sample uses random data to populate the chart. To populate ' a chart with database data see the following resources: ' - Use the getLiveData() method using the dataEngine to query a database. ' - Help File > Getting Started > Data Tutorials ' - DataEngine Class in the help file ' - Sample: features/DataEngine.aspx
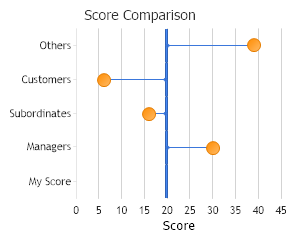
Dim mySC As SeriesCollection = getRandomData() mySC(0)(0).Name = "My Score" mySC(0)(1).Name = "Managers" mySC(0)(2).Name = "Subordinates" mySC(0)(3).Name = "Customers" mySC(0)(4).Name = "Others"
' Add the random data. Chart.SeriesCollection.Add(mySC) End Sub
Function getRandomData() As SeriesCollection Dim myR As Random = New Random(2) Dim SC As SeriesCollection = New SeriesCollection() Dim a As Integer = 0 Dim b As Integer = 0 For a = 1 To 1 Dim s As Series = New Series() For b = 1 To 5 Dim e As Element = New Element() e.YValue = 20 e.YValueStart = 19.5R s.Elements.Add(e)
If b > 1 Then Dim val As Integer = myR.Next(40) e.SubValues.Add(SubValue.FromValue(val)) e.SubValues.Add(SubValue.FromValue(val)) e.SubValues(1).Type = SubValueType.Marker End If Next b SC.Add(s) Next a Return SC End Function
Function getLiveData() As SeriesCollection Dim de As DataEngine = New DataEngine("ConnectionString goes here") de.ChartObject = Chart ' Necessary to view any errors the dataEngine may throw. de.SqlStatement = "SELECT XAxisColumn, YAxisColumn FROM ...." Return de.GetSeries() End Function