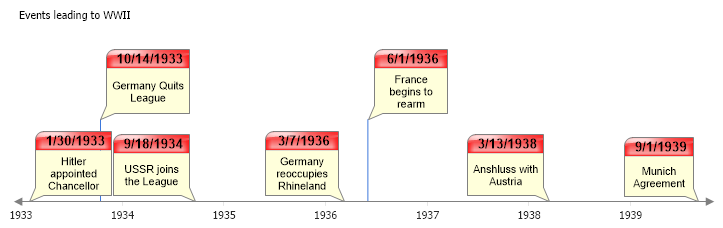
Time Line
Demonstrates how to create a timeline chart.
<%@ Page Language="C#" Description="dotnetCHARTING Component" %>
<%@ Register TagPrefix="dotnet" Namespace="dotnetCHARTING" Assembly="dotnetCHARTING" %>
<%@ Import Namespace="System.Drawing" %>
<%@ Import Namespace="System.Drawing.Drawing2D" %>
<script runat="server">
void Page_Load(Object sender, EventArgs e)
{
// Demonstrates how to create a timeline chart.
Chart.TempDirectory = "temp";
Chart.Debug = true;
Chart.Type = ChartType.Combo;
Chart.Size = "720x230";
Chart.XAxis.Scale = Scale.Time;
Chart.LegendBox.Visible = false;
Chart.YAxis.Clear();
Chart.YAxis.Maximum = 12;
Chart.ChartArea.ClearColors();
Chart.ChartArea.Label.Text = "Events leading to WWII";
Chart.XAxis.Line.EndCap = LineCap.ArrowAnchor;
Chart.XAxis.Line.StartCap = LineCap.ArrowAnchor;
Chart.XAxis.Line.AnchorCapScale = 4;
Chart.XAxis.StaticColumnWidth = 1;
Chart.XAxis.Line.Color = Color.Gray;
Chart.XAxis.TimeScaleLabels.Mode = TimeScaleLabelMode.Smart;
Chart.DefaultElement.Annotation = new Annotation("%Name");
Chart.DefaultElement.Annotation.HeaderLabel.Text = " %XValue";
Chart.DefaultElement.Annotation.HeaderBackground.Color = Color.FromArgb(50, 255, 0, 0);
Chart.DefaultElement.Annotation.HeaderLabel.Font = new Font("Arial", 10,FontStyle.Bold);
Chart.DefaultElement.Annotation.HeaderBackground.ShadingEffectMode = ShadingEffectMode.Four;
Chart.DefaultElement.Annotation.Padding = 4;
Chart.DefaultElement.Annotation.CornerTopLeft = BoxCorner.Round;
// *DYNAMIC DATA NOTE*
// This sample uses random data to populate the chart. To populate
// a chart with database data see the following resources:
// - Use the getLiveData() method using the dataEngine to query a database.
// - Help File > Getting Started > Data Tutorials
// - DataEngine Class in the help file
// - Sample: features/DataEngine.aspx
SeriesCollection mySC = getRandomData();
Element el1 = new Element("Hitler appointed Chancellor");
el1.XDateTime = new DateTime(1933, 1, 30);
el1.YValue = 0;
Element el2 = new Element("Germany Quits League");
el2.XDateTime = new DateTime(1933, 10, 14);
el2.YValue = 5;
el2.Annotation.Orientation = dotnetCHARTING.Orientation.TopRight;
Element el3 = new Element("USSR joins the League");
el3.XDateTime = new DateTime(1934, 9, 18);
el3.YValue = 0;
Element el4 = new Element("France begins to rearm");
el4.XDateTime = new DateTime(1936, 6, 1);
el4.YValue = 5;
el4.Annotation.Orientation = dotnetCHARTING.Orientation.TopRight;
Element el5 = new Element("Germany reoccupies Rhineland");
el5.XDateTime = new DateTime(1936, 3, 7);
el5.YValue = 0;
Element el6 = new Element("Anshluss with Austria");
el6.XDateTime = new DateTime(1938, 3, 13);
el6.YValue = 0;
Element el7 = new Element("Munich Agreement");
el7.XDateTime = new DateTime(1939, 9, 1);
el7.YValue = 0;
Series s = new Series();
s.Elements.Add(el1, el2, el3,el4,el5,el6,el7);
// Add the random data.
Chart.SeriesCollection.Add(s);
}
SeriesCollection getRandomData()
{
Random myR = new Random(1);
SeriesCollection SC = new SeriesCollection();
int a = 0;
int b = 0;
for (a = 1; a < 5; a++)
{
Series s = new Series("Series " + a.ToString());
for (b = 1; b < 5; b++)
{
Element e = new Element("Element " + b.ToString());
e.YValue = myR.Next(50);
s.Elements.Add(e);
}
SC.Add(s);
}
return SC;
}
SeriesCollection getLiveData()
{
DataEngine de = new DataEngine("ConnectionString goes here");
de.ChartObject = Chart; // Necessary to view any errors the dataEngine may throw.
de.SqlStatement = "SELECT XAxisColumn, YAxisColumn FROM ....";
return de.GetSeries();
}
</script>
<html xmlns="http://www.w3.org/1999/xhtml">
<head>
<title>.netCHARTING Sample</title>
</head>
<body>
<div align="center">
<dotnet:Chart ID="Chart" runat="server" />
</div>
</body>
</html>
<%@ Page Language="vb" Description="dotnetCHARTING Component" %>
<%@ Register TagPrefix="dotnet" Namespace="dotnetCHARTING" Assembly="dotnetCHARTING" %>
<%@ Import Namespace="System.Drawing" %>
<%@ Import Namespace="System.Drawing.Drawing2D" %>
<script runat="server">
Sub Page_Load(ByVal sender As Object, ByVal e As EventArgs)
' Demonstrates how to create a timeline chart.
Chart.TempDirectory = "temp"
Chart.Debug = True
Chart.Type = ChartType.Combo
Chart.Size = "720x230"
Chart.XAxis.Scale = Scale.Time
Chart.LegendBox.Visible = False
Chart.YAxis.Clear()
Chart.YAxis.Maximum = 12
Chart.ChartArea.ClearColors()
Chart.ChartArea.Label.Text = "Events leading to WWII"
Chart.XAxis.Line.EndCap = LineCap.ArrowAnchor
Chart.XAxis.Line.StartCap = LineCap.ArrowAnchor
Chart.XAxis.Line.AnchorCapScale = 4
Chart.XAxis.StaticColumnWidth = 1
Chart.XAxis.Line.Color = Color.Gray
Chart.XAxis.TimeScaleLabels.Mode = TimeScaleLabelMode.Smart
Chart.DefaultElement.Annotation = New Annotation("%Name")
Chart.DefaultElement.Annotation.HeaderLabel.Text = " %XValue"
Chart.DefaultElement.Annotation.HeaderBackground.Color = Color.FromArgb(50, 255, 0, 0)
Chart.DefaultElement.Annotation.HeaderLabel.Font = New Font("Arial", 10,FontStyle.Bold)
Chart.DefaultElement.Annotation.HeaderBackground.ShadingEffectMode = ShadingEffectMode.Four
Chart.DefaultElement.Annotation.Padding = 4
Chart.DefaultElement.Annotation.CornerTopLeft = BoxCorner.Round
' *DYNAMIC DATA NOTE*
' This sample uses random data to populate the chart. To populate
' a chart with database data see the following resources:
' - Use the getLiveData() method using the dataEngine to query a database.
' - Help File > Getting Started > Data Tutorials
' - DataEngine Class in the help file
' - Sample: features/DataEngine.aspx
Dim mySC As SeriesCollection = getRandomData()
Dim el1 As Element = New Element("Hitler appointed Chancellor")
el1.XDateTime = New DateTime(1933, 1, 30)
el1.YValue = 0
Dim el2 As Element = New Element("Germany Quits League")
el2.XDateTime = New DateTime(1933, 10, 14)
el2.YValue = 5
el2.Annotation.Orientation = dotnetCHARTING.Orientation.TopRight
Dim el3 As Element = New Element("USSR joins the League")
el3.XDateTime = New DateTime(1934, 9, 18)
el3.YValue = 0
Dim el4 As Element = New Element("France begins to rearm")
el4.XDateTime = New DateTime(1936, 6, 1)
el4.YValue = 5
el4.Annotation.Orientation = dotnetCHARTING.Orientation.TopRight
Dim el5 As Element = New Element("Germany reoccupies Rhineland")
el5.XDateTime = New DateTime(1936, 3, 7)
el5.YValue = 0
Dim el6 As Element = New Element("Anshluss with Austria")
el6.XDateTime = New DateTime(1938, 3, 13)
el6.YValue = 0
Dim el7 As Element = New Element("Munich Agreement")
el7.XDateTime = New DateTime(1939, 9, 1)
el7.YValue = 0
Dim s As Series = New Series()
s.Elements.Add(el1, el2, el3,el4,el5,el6,el7)
' Add the random data.
Chart.SeriesCollection.Add(s)
End Sub
Function getRandomData() As SeriesCollection
Dim myR As Random = New Random(1)
Dim SC As SeriesCollection = New SeriesCollection()
Dim a As Integer = 0
Dim b As Integer = 0
For a = 1 To 4
Dim s As Series = New Series("Series " & a.ToString())
For b = 1 To 4
Dim e As Element = New Element("Element " & b.ToString())
e.YValue = myR.Next(50)
s.Elements.Add(e)
Next b
SC.Add(s)
Next a
Return SC
End Function
Function getLiveData() As SeriesCollection
Dim de As DataEngine = New DataEngine("ConnectionString goes here")
de.ChartObject = Chart ' Necessary to view any errors the dataEngine may throw.
de.SqlStatement = "SELECT XAxisColumn, YAxisColumn FROM ...."
Return de.GetSeries()
End Function
</script>
<html xmlns="http://www.w3.org/1999/xhtml">
<head>
<title>.netCHARTING Sample</title>
</head>
<body>
<div align="center">
<dotnet:Chart ID="Chart" runat="server" />
</div>
</body>
</html>