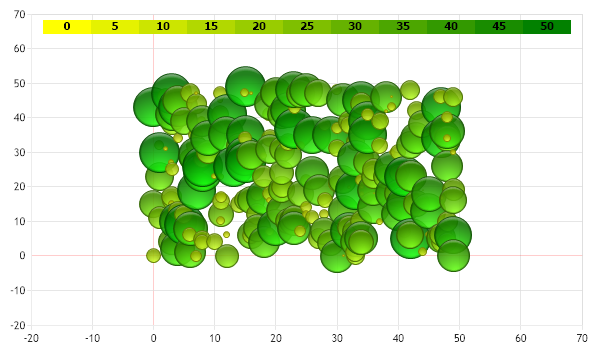
Gallery
Color Range Bubbles
<%@ Page Language="C#" Description="dotnetCHARTING Component" %>
<%@ Register TagPrefix="dnc" Namespace="dotnetCHARTING" Assembly="dotnetCHARTING" %>
<%@ Import Namespace="System.Drawing" %>
<%@ Import Namespace="System.Drawing.Drawing2D" %>
<%@ Import Namespace="dotnetCHARTING.Mapping" %>
<script runat="server">
void Page_Load(Object sender, EventArgs e)
{
// Demonstrates using a color range to color bubbles based on their size.
//Chart Styling
Chart.Size = "600x350";
//Chart.Title = ".netCHARTING Sample";
Chart.TempDirectory = "temp";
Chart.Debug = true;
Chart.DefaultSeries.Type = SeriesType.Bubble;
Chart.DefaultElement.Transparency = 10;
Chart.MaximumBubbleSize = 40;
Chart.LegendBox.Visible = false;
Chart.ShadingEffectMode = ShadingEffectMode.Three;
Chart.YAxis.AlternateGridBackground.Color = Color.Empty;
// Titlebox Styling
Chart.TitleBox.CornerTopLeft = BoxCorner.Round;
Chart.TitleBox.CornerTopRight = BoxCorner.Round;
Chart.TitleBox.Position = TitleBoxPosition.Full;
Chart.TitleBox.Background.ShadingEffectMode = ShadingEffectMode.Five;
Chart.TitleBox.Background.Color = Color.LightGray;
//--------------------
SmartColor sc2 = new SmartColor(Color.Yellow, Color.Green, new ScaleRange(0, 50), ElementValue.BubbleSize);
Chart.SmartPalette.Add("*", sc2);
// *DYNAMIC DATA NOTE*
// This sample uses random data to populate the chart. To populate
// a chart with database data see the following resources:
// - Use the getLiveData() method using the dataEngine to query a database.
// - Help File > Getting Started > Data Tutorials
// - DataEngine Class in the help file
// - Sample: features/DataEngine.aspx
SeriesCollection mySC = getRandomData();
// This will help draw the smaller bubbles in front.
mySC[0].Sort(ElementValue.BubbleSize, "Asc");
// Add the random data.
Chart.SeriesCollection.Add(mySC);
// Create the color swatch with values.
Chart.ChartArea.Label.Text = getSwatch(450, Chart.SmartPalette, 10);
Chart.ChartArea.Label.Alignment = StringAlignment.Center;
}
string getSwatch(int width, SmartPalette sp, int divisions)
{
double max = (double)sp.GetScaleRange("*").ValueHigh;
string swatch = "", spacers = "";
int boxWidth = width / divisions;
for (int i = 0; i <= divisions; i++)
{
spacers += "<Chart:Spacer size='" + boxWidth + "x1'>";
string c = getHTMLColor(sp.GetValueColor("", (i * (max / divisions))));
swatch += "<block hAlign='Center' bgColor='" + c + "' fColor='Black' fStyle='Bold'>" + (i * (max / divisions));
}
return spacers + "<row>" + swatch;
}
string getHTMLColor(Color c)
{
return "#" + c.R.ToString("X2") + c.G.ToString("X2") + c.B.ToString("X2");
}
SeriesCollection getRandomData()
{
Random myR = new Random(1);
SeriesCollection SC = new SeriesCollection();
for (int a = 1; a < 2; a++)
{
Series s = new Series("Series " + a.ToString());
for (int b = 1; b < 250; b++)
{
Element e = new Element();//"Element " + b.ToString());
e.YValue = myR.Next(50);
e.XValue = myR.Next(50);
e.BubbleSize = myR.Next(50);
s.Elements.Add(e);
}
SC.Add(s);
}
return SC;
}
SeriesCollection getLiveData()
{
DataEngine de = new DataEngine("ConnectionString goes here");
de.ChartObject = Chart; // Necessary to view any errors the dataEngine may throw.
de.SqlStatement = "SELECT XAxisColumn, YAxisColumn FROM ....";
return de.GetSeries();
}
</script>
<html xmlns="http://www.w3.org/1999/xhtml">
<head>
<title>.netCHARTING Sample</title>
</head>
<body>
<div align="center">
<dnc:Chart ID="Chart" runat="server" />
</div>
</body>
</html>
<%@ Page Language="vb" Description="dotnetCHARTING Component" %>
<%@ Register TagPrefix="dnc" Namespace="dotnetCHARTING" Assembly="dotnetCHARTING" %>
<%@ Import Namespace="System.Drawing" %>
<%@ Import Namespace="System.Drawing.Drawing2D" %>
<%@ Import Namespace="dotnetCHARTING.Mapping" %>
<script runat="server">
Sub Page_Load(ByVal sender As Object, ByVal e As EventArgs)
' Demonstrates using a color range to color bubbles based on their size.
'Chart Styling
Chart.Size = "600x350"
'Chart.Title = ".netCHARTING Sample";
Chart.TempDirectory = "temp"
Chart.Debug = True
Chart.DefaultSeries.Type = SeriesType.Bubble
Chart.DefaultElement.Transparency = 10
Chart.MaximumBubbleSize = 40
Chart.LegendBox.Visible = False
Chart.ShadingEffectMode = ShadingEffectMode.Three
Chart.YAxis.AlternateGridBackground.Color = Color.Empty
' Titlebox Styling
Chart.TitleBox.CornerTopLeft = BoxCorner.Round
Chart.TitleBox.CornerTopRight = BoxCorner.Round
Chart.TitleBox.Position = TitleBoxPosition.Full
Chart.TitleBox.Background.ShadingEffectMode = ShadingEffectMode.Five
Chart.TitleBox.Background.Color = Color.LightGray
'--------------------
Dim sc2 As SmartColor = New SmartColor(Color.Yellow, Color.Green, New ScaleRange(0, 50), ElementValue.BubbleSize)
Chart.SmartPalette.Add("*", sc2)
' *DYNAMIC DATA NOTE*
' This sample uses random data to populate the chart. To populate
' a chart with database data see the following resources:
' - Use the getLiveData() method using the dataEngine to query a database.
' - Help File > Getting Started > Data Tutorials
' - DataEngine Class in the help file
' - Sample: features/DataEngine.aspx
Dim mySC As SeriesCollection = getRandomData()
' This will help draw the smaller bubbles in front.
mySC(0).Sort(ElementValue.BubbleSize, "Asc")
' Add the random data.
Chart.SeriesCollection.Add(mySC)
' Create the color swatch with values.
Chart.ChartArea.Label.Text = getSwatch(450, Chart.SmartPalette, 10)
Chart.ChartArea.Label.Alignment = StringAlignment.Center
End Sub
Function getSwatch(ByVal width As Integer, ByVal sp As SmartPalette, ByVal divisions As Integer) As String
Dim max As Double = CDbl(sp.GetScaleRange("*").ValueHigh)
Dim swatch As String = "", spacers As String = ""
Dim boxWidth As Integer = width / divisions
For i As Integer = 0 To divisions
spacers &= "<Chart:Spacer size='" & boxWidth & "x1'>"
Dim c As String = getHTMLColor(sp.GetValueColor("", (i * (max / divisions))))
swatch &= "<block hAlign='Center' bgColor='" & c & "' fColor='Black' fStyle='Bold'>" & (i * (max / divisions))
Next i
Return spacers & "<row>" & swatch
End Function
Function getHTMLColor(ByVal c As Color) As String
Return "#" & c.R.ToString("X2") + c.G.ToString("X2") + c.B.ToString("X2")
End Function
Function getRandomData() As SeriesCollection
Dim myR As Random = New Random(1)
Dim SC As SeriesCollection = New SeriesCollection()
For a As Integer = 1 To 1
Dim s As Series = New Series("Series " & a.ToString())
For b As Integer = 1 To 249
Dim e As Element = New Element() '"Element " + b.ToString());
e.YValue = myR.Next(50)
e.XValue = myR.Next(50)
e.BubbleSize = myR.Next(50)
s.Elements.Add(e)
Next b
SC.Add(s)
Next a
Return SC
End Function
Function getLiveData() As SeriesCollection
Dim de As DataEngine = New DataEngine("ConnectionString goes here")
de.ChartObject = Chart ' Necessary to view any errors the dataEngine may throw.
de.SqlStatement = "SELECT XAxisColumn, YAxisColumn FROM ...."
Return de.GetSeries()
End Function
</script>
<html xmlns="http://www.w3.org/1999/xhtml">
<head>
<title>.netCHARTING Sample</title>
</head>
<body>
<div align="center">
<dnc:Chart ID="Chart" runat="server" />
</div>
</body>
</html>
- Sample FilenameColorRangeBubbles.aspx
- Version6.1
- Uses DatabaseNo