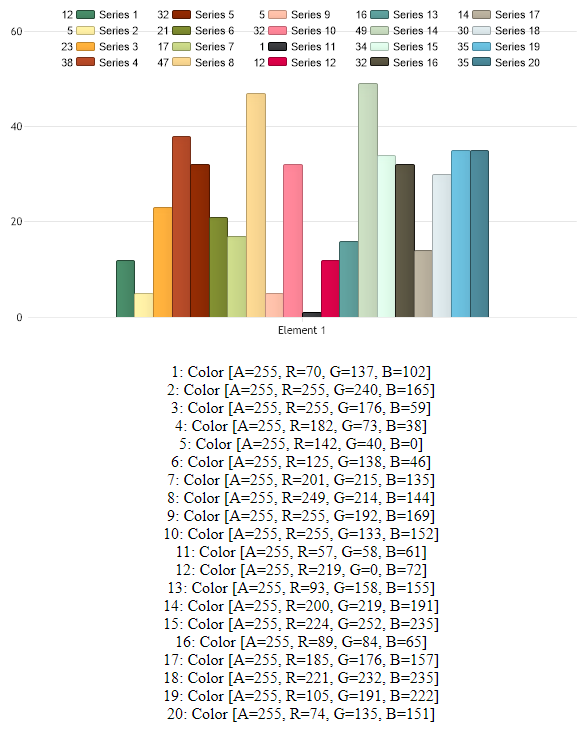
// The following code adds two 5 color palettes to the main chart palette. Chart.PaletteName = Palette.FiveColor1; Chart.PaletteAdd(Palette.FiveColor2); Chart.PaletteAdd(Palette.FiveColor3); Chart.PaletteAdd(Palette.FiveColor4); Chart.MarginTop = 30;
Chart.LegendBox.Position = new Rectangle(new Point(50, 10),new Size(500,60)); Chart.MarginRight = 20; // Colors added above all end up in the Chart.Palette color array. // The resulting colors will be printed to a label on the chart. int i = 1; foreach (Color c in Chart.Palette) { label1.Text += i.ToString() + ": " + c.ToString() + "<br>"; i++; }
// *DYNAMIC DATA NOTE* // This sample uses random data to populate the chart. To populate // a chart with database data see the following resources: // - Use the getLiveData() method using the dataEngine to query a database. // - Help File > Getting Started > Data Tutorials // - DataEngine Class in the help file // - Sample: features/DataEngine.aspx
SeriesCollection mySC = getRandomData();
// Add the random data. Chart.SeriesCollection.Add(mySC); }
SeriesCollection getRandomData() { Random myR = new Random(1); SeriesCollection SC = new SeriesCollection(); int a = 0; int b = 0; for (a = 1; a < 21; a++) { Series s = new Series("Series " + a.ToString()); for (b = 1; b < 2; b++) { Element e = new Element("Element " + b.ToString()); e.YValue = myR.Next(50); s.Elements.Add(e); } SC.Add(s); } return SC; }
SeriesCollection getLiveData() { DataEngine de = new DataEngine("ConnectionString goes here"); de.ChartObject = Chart; // Necessary to view any errors the dataEngine may throw. de.SqlStatement = "SELECT XAxisColumn, YAxisColumn FROM ...."; return de.GetSeries(); }
' The following code adds two 5 color palettes to the main chart palette. Chart.PaletteName = Palette.FiveColor1 Chart.PaletteAdd(Palette.FiveColor2) Chart.PaletteAdd(Palette.FiveColor3) Chart.PaletteAdd(Palette.FiveColor4) Chart.MarginTop = 30
Chart.LegendBox.Position = New Rectangle(New Point(50, 10),New Size(500,60)) Chart.MarginRight = 20 ' Colors added above all end up in the Chart.Palette color array. ' The resulting colors will be printed to a label on the chart. Dim i As Integer = 1 For Each c As Color In Chart.Palette label1.Text += i.ToString() & ": " & c.ToString() & "<br>" i += 1 Next c
' *DYNAMIC DATA NOTE* ' This sample uses random data to populate the chart. To populate ' a chart with database data see the following resources: ' - Use the getLiveData() method using the dataEngine to query a database. ' - Help File > Getting Started > Data Tutorials ' - DataEngine Class in the help file ' - Sample: features/DataEngine.aspx
Dim mySC As SeriesCollection = getRandomData()
' Add the random data. Chart.SeriesCollection.Add(mySC) End Sub
Function getRandomData() As SeriesCollection Dim myR As Random = New Random(1) Dim SC As SeriesCollection = New SeriesCollection() Dim a As Integer = 0 Dim b As Integer = 0 For a = 1 To 20 Dim s As Series = New Series("Series " & a.ToString()) For b = 1 To 1 Dim e As Element = New Element("Element " & b.ToString()) e.YValue = myR.Next(50) s.Elements.Add(e) Next b SC.Add(s) Next a Return SC End Function
Function getLiveData() As SeriesCollection Dim de As DataEngine = New DataEngine("ConnectionString goes here") de.ChartObject = Chart ' Necessary to view any errors the dataEngine may throw. de.SqlStatement = "SELECT XAxisColumn, YAxisColumn FROM ...." Return de.GetSeries() End Function