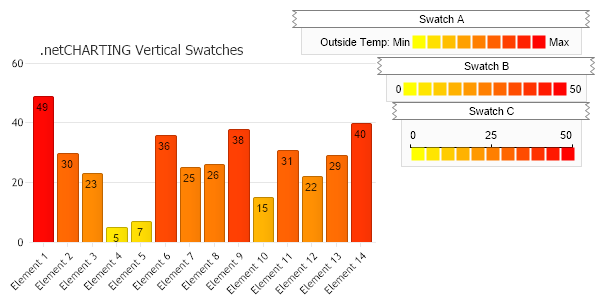
Color Swatches Horizontal
Demonstrates generating vertical swatch markup and using them in annotations.
<%@ Page Language="C#" Description="dotnetCHARTING Component" %>
<%@ Register TagPrefix="dnc" Namespace="dotnetCHARTING" Assembly="dotnetCHARTING" %>
<%@ Import Namespace="System.Drawing" %>
<%@ Import Namespace="System.Drawing.Drawing2D" %>
<%@ Import Namespace="dotnetCHARTING.Mapping" %>
<script runat="server">
void Page_Load(Object sender, EventArgs e)
{
// Demonstrates generating vertical swatch markup and using them in annotations.
Chart.Size = "600x300";
Chart.Title = ".netCHARTING Vertical Swatches";
Chart.TempDirectory = "temp";
Chart.Debug = true;
Chart.MarginRight = 220;
Chart.MarginTop = 20;
Chart.LegendBox.Visible = false;
Chart.DefaultElement.ShowValue = true;
// *DYNAMIC DATA NOTE*
// This sample uses random data to populate the chart. To populate
// a chart with database data see the following resources:
// - Use the getLiveData() method using the dataEngine to query a database.
// - Help File > Getting Started > Data Tutorials
// - DataEngine Class in the help file
// - Sample: features/DataEngine.aspx
SeriesCollection mySC = getRandomData();
// Add the random data.
Chart.SeriesCollection.Add(mySC);
// Setup Smart Palette
SmartColor sc2 = new SmartColor(Color.Yellow, Color.Red, new ScaleRange(0, 50));
Chart.SmartPalette.Add("*", sc2);
// Create annotations with horizontal swatches
Annotation an = new Annotation("<block >Outside Temp: Min" + getSwatch( Chart.SmartPalette, 8, false) + "<block>Max");
an.Position = new Point(300, 8);
an.Size = new Size(280, 0);
an.Header.Label.Text = "Swatch A";
Chart.Annotations.Add(an);
Annotation an2 = new Annotation("0" + getSwatch( Chart.SmartPalette, 10, false) + "<block>50");
an2.Position = new Point(385, 55);
an2.Size = new Size(200, 0);
an2.Header.Label.Text = "Swatch B";
Chart.Annotations.Add(an2);
Annotation an3 = new Annotation("<Chart:Scale values='0,25,50' width='165'><row>" + getSwatch( Chart.SmartPalette, 10, false) + "");
an3.Position = new Point(400, 100);
an3.Size = new Size(180, 0);
an3.Header.Label.Text = "Swatch C";
Chart.Annotations.Add(an3);
foreach (Annotation anno in Chart.Annotations)
{
anno.Label.Alignment = StringAlignment.Center;
anno.Header.StartCap = BoxCapStyle.Torn;
anno.Header.EndCap = BoxCapStyle.Torn;
anno.Header.Offset = new Point(0, -3);
}
}
string getSwatch( SmartPalette sp, int divisions, bool withValues)
{
// Get Maximum Value of the smart palette range
double max = (double)sp.GetScaleRange("*").ValueHigh;
string swatch = "";
// Generate swatch string for each division.
for (int i = 0; i <= divisions; i++)
{
// Get the color of the current division.
string color = getHTMLColor(sp.GetValueColor("", (i * (max / divisions))));
if (withValues)
swatch += "<block bgColor='" + color + "'>" + (i * (max / divisions));
else
swatch += "<block bgColor='" + color + "' fColor='Transparent'>__";
}
//return the swatch string.
return swatch;
}
string getHTMLColor(Color c)
{
return "#" + c.R.ToString("X2") + c.G.ToString("X2") + c.B.ToString("X2");
}
SeriesCollection getRandomData()
{
Random myR = new Random(4);
SeriesCollection SC = new SeriesCollection();
for (int a = 1; a < 2; a++)
{
Series s = new Series("Series " + a.ToString());
int count = 5 + myR.Next(20);
for (int b = 1; b < 15; b++)
{
Element e = new Element("Element " + b.ToString());
e.YValue = 5 + myR.Next(45);
s.Elements.Add(e);
}
SC.Add(s);
}
return SC;
}
SeriesCollection getLiveData()
{
DataEngine de = new DataEngine(ConfigurationManager.AppSettings["DNCConnectionString"]);
de.ChartObject = Chart; // Necessary to view any errors the dataEngine may throw.
de.SqlStatement = "SELECT XAxisColumn, YAxisColumn FROM ....";
return de.GetSeries();
}
</script>
<html xmlns="http://www.w3.org/1999/xhtml">
<head>
<title>.netCHARTING Sample</title>
</head>
<body>
<div align="center">
<dnc:Chart ID="Chart" runat="server" />
</div>
<asp:Label ID="Label1" runat="server" />
</body>
</html>
<%@ Page Language="vb" Description="dotnetCHARTING Component" %>
<%@ Register TagPrefix="dnc" Namespace="dotnetCHARTING" Assembly="dotnetCHARTING" %>
<%@ Import Namespace="System.Drawing" %>
<%@ Import Namespace="System.Drawing.Drawing2D" %>
<%@ Import Namespace="dotnetCHARTING.Mapping" %>
<script runat="server">
Sub Page_Load(ByVal sender As Object, ByVal e As EventArgs)
' Demonstrates generating vertical swatch markup and using them in annotations.
Chart.Size = "600x300"
Chart.Title = ".netCHARTING Vertical Swatches"
Chart.TempDirectory = "temp"
Chart.Debug = True
Chart.MarginRight = 220
Chart.MarginTop = 20
Chart.LegendBox.Visible = False
Chart.DefaultElement.ShowValue = True
' *DYNAMIC DATA NOTE*
' This sample uses random data to populate the chart. To populate
' a chart with database data see the following resources:
' - Use the getLiveData() method using the dataEngine to query a database.
' - Help File > Getting Started > Data Tutorials
' - DataEngine Class in the help file
' - Sample: features/DataEngine.aspx
Dim mySC As SeriesCollection = getRandomData()
' Add the random data.
Chart.SeriesCollection.Add(mySC)
' Setup Smart Palette
Dim sc2 As SmartColor = New SmartColor(Color.Yellow, Color.Red, New ScaleRange(0, 50))
Chart.SmartPalette.Add("*", sc2)
' Create annotations with horizontal swatches
Dim an As Annotation = New Annotation("<block >Outside Temp: Min" & getSwatch(Chart.SmartPalette, 8, False) & "<block>Max")
an.Position = New Point(300, 8)
an.Size = New Size(280, 0)
an.Header.Label.Text = "Swatch A"
Chart.Annotations.Add(an)
Dim an2 As Annotation = New Annotation("0" & getSwatch(Chart.SmartPalette, 10, False) & "<block>50")
an2.Position = New Point(385, 55)
an2.Size = New Size(200, 0)
an2.Header.Label.Text = "Swatch B"
Chart.Annotations.Add(an2)
Dim an3 As Annotation = New Annotation("<Chart:Scale values='0,25,50' width='165'><row>" & getSwatch(Chart.SmartPalette, 10, False) & "")
an3.Position = New Point(400, 100)
an3.Size = New Size(180, 0)
an3.Header.Label.Text = "Swatch C"
Chart.Annotations.Add(an3)
For Each anno As Annotation In Chart.Annotations
anno.Label.Alignment = StringAlignment.Center
anno.Header.StartCap = BoxCapStyle.Torn
anno.Header.EndCap = BoxCapStyle.Torn
anno.Header.Offset = New Point(0, -3)
Next anno
End Sub
Function getSwatch(ByVal sp As SmartPalette, ByVal divisions As Integer, ByVal withValues As Boolean) As String
' Get Maximum Value of the smart palette range
Dim max As Double = CDbl(sp.GetScaleRange("*").ValueHigh)
Dim swatch As String = ""
' Generate swatch string for each division.
For i As Integer = 0 To divisions
' Get the color of the current division.
Dim color As String = getHTMLColor(sp.GetValueColor("", (i * (max / divisions))))
If withValues Then
swatch &= "<block bgColor='" & color & "'>" & (i * (max / divisions))
Else
swatch &= "<block bgColor='" & color & "' fColor='Transparent'>__"
End If
Next i
'return the swatch string.
Return swatch
End Function
Function getHTMLColor(ByVal c As Color) As String
Return "#" & c.R.ToString("X2") + c.G.ToString("X2") + c.B.ToString("X2")
End Function
Function getRandomData() As SeriesCollection
Dim myR As Random = New Random(4)
Dim SC As SeriesCollection = New SeriesCollection()
For a As Integer = 1 To 1
Dim s As Series = New Series("Series " & a.ToString())
Dim count As Integer = 5 + myR.Next(20)
For b As Integer = 1 To 14
Dim e As Element = New Element("Element " & b.ToString())
e.YValue = 5 + myR.Next(45)
s.Elements.Add(e)
Next b
SC.Add(s)
Next a
Return SC
End Function
Function getLiveData() As SeriesCollection
Dim de As DataEngine = New DataEngine(ConfigurationManager.AppSettings("DNCConnectionString"))
de.ChartObject = Chart ' Necessary to view any errors the dataEngine may throw.
de.SqlStatement = "SELECT XAxisColumn, YAxisColumn FROM ...."
Return de.GetSeries()
End Function
</script>
<html xmlns="http://www.w3.org/1999/xhtml">
<head>
<title>.netCHARTING Sample</title>
</head>
<body>
<div align="center">
<dnc:Chart ID="Chart" runat="server" />
</div>
<asp:Label ID="Label1" runat="server" />
</body>
</html>