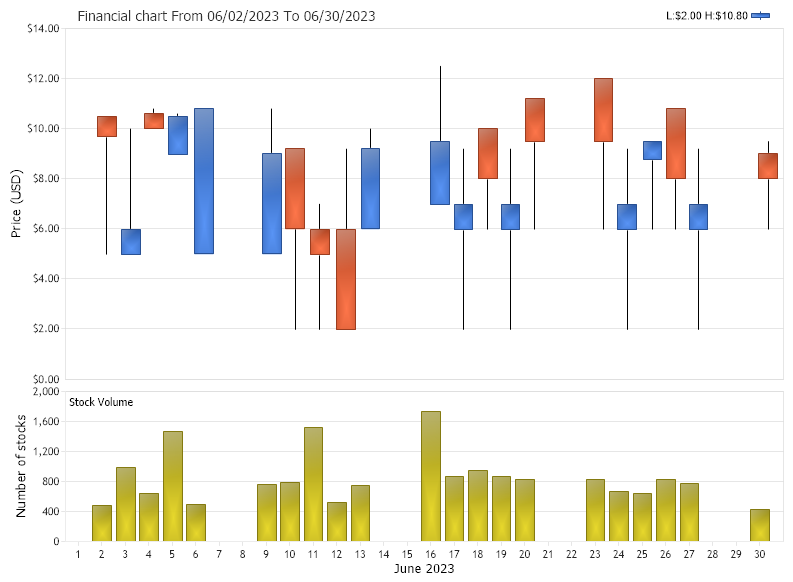
ChartArea Financial
Demonstrates how to generate a financial chart with two chart areas.
<%@ Page Language="C#" Description="dotnetCHARTING Component" %>
<%@ Register TagPrefix="dotnet" Namespace="dotnetCHARTING" Assembly="dotnetCHARTING"%>
<%@ Import Namespace="System.Drawing" %>
<html xmlns="http://www.w3.org/1999/xhtml">
<head>
<title>.netCHARTING Sample</title>
<script runat="server">
void Page_Load(Object sender,EventArgs e)
{
//set global properties
Chart.Title="Financial chart";
Chart.TempDirectory="temp";
Chart.Debug=true;
Chart.DateGrouping = TimeInterval.Days;
Chart.ShadingEffect = true;
Chart.LegendBox.Position = LegendBoxPosition.None;
Chart.Size="800X600";
Chart.XAxis.Label.Text="June 2023";
Chart.XAxis.Scale = Scale.Time;
Chart.XAxis.FormatString = "%d";
Chart.XAxis.TimeInterval = TimeInterval.Day;
Chart.XAxis.Maximum = new DateTime(2023,6,30,23,59,59);
Chart.YAxis.Label.Text = "Price (USD)";
Chart.YAxis.FormatString ="currency";
Chart.TitleBox.Position = TitleBoxPosition.FullWithLegend;
// Set the financial series type
Chart.Series.DefaultElement.ShowValue=false;
Chart.Series.DefaultElement.ToolTip="L:%low-H:%high";
Chart.Series.DefaultElement.SmartLabel.Font = new Font("Arial", 6);
Chart.Series.DefaultElement.SmartLabel.Text="O:%open-C:%Close";
Chart.Series.Type = SeriesTypeFinancial.CandleStick;
Chart.Series.ConnectionString = ConfigurationManager.AppSettings["DNCConnectionString"];
Chart.Series.StartDate=new DateTime (2023,6,1,0,0,0);
Chart.Series.EndDate = new DateTime (2023,6,30,23,59,59);
Chart.Series.SqlStatement= @"SELECT Transdate,price FROM Financial WHERE Transdate >= #STARTDATE# AND Transdate <= #ENDDATE# ORDER BY Transdate";
Chart.Series.DataFields="xAxis=Transdate,price=price";
Chart.SeriesCollection.Add();
// Create the second chart area
ChartArea ca2 = new ChartArea();
ca2.LegendBox.Visible = false;
ca2.Label.Text = "Stock Volume";
ca2.YAxis.Label.Text = "Number of stocks";
ca2.Series.Name="Stock Volume";
ca2.DateGrouping = TimeInterval.Days;
ca2.HeightPercentage = 30;
//Add a valume series to the chart area
ca2.Series.ConnectionString = ConfigurationManager.AppSettings["DNCConnectionString"];
ca2.Series.StartDate=new DateTime (2023,6,1,0,0,0);
ca2.Series.EndDate = new DateTime (2023,6,30,23,59,59);
ca2.Series.SqlStatement= @"SELECT Transdate,volume FROM Financial WHERE Transdate >= #STARTDATE# AND Transdate <= #ENDDATE# ORDER BY Transdate";
ca2.Series.DataFields="xAxis=TransDate,yAxis=Volume";
ca2.Series.DefaultElement.ToolTip="%YValue";
ca2.Series.DefaultElement.Color = Color.FromArgb(219, 203, 24);
ca2.SeriesCollection.Add();
// Add the new area to the chart.
Chart.ExtraChartAreas.Add(ca2);
}
</script>
</head>
<body>
<div style="text-align:center">
<dotnet:Chart id="Chart" runat="server">
</dotnet:Chart>
</div>
</body>
</html>
<%@ Page Language="vb" Description="dotnetCHARTING Component" %>
<%@ Register TagPrefix="dotnet" Namespace="dotnetCHARTING" Assembly="dotnetCHARTING"%>
<%@ Import Namespace="System.Drawing" %>
<html xmlns="http://www.w3.org/1999/xhtml">
<head>
<title>.netCHARTING Sample</title>
<script runat="server">
Sub Page_Load(ByVal sender As Object, ByVal e As EventArgs)
'set global properties
Chart.Title="Financial chart"
Chart.TempDirectory="temp"
Chart.Debug=True
Chart.DateGrouping = TimeInterval.Days
Chart.ShadingEffect = True
Chart.LegendBox.Position = LegendBoxPosition.None
Chart.Size="800X600"
Chart.XAxis.Label.Text="June 2023"
Chart.XAxis.Scale = Scale.Time
Chart.XAxis.FormatString = "%d"
Chart.XAxis.TimeInterval = TimeInterval.Day
Chart.XAxis.Maximum = New DateTime(2023,6,30,23,59,59)
Chart.YAxis.Label.Text = "Price (USD)"
Chart.YAxis.FormatString ="currency"
Chart.TitleBox.Position = TitleBoxPosition.FullWithLegend
' Set the financial series type
Chart.Series.DefaultElement.ShowValue=False
Chart.Series.DefaultElement.ToolTip="L:%low-H:%high"
Chart.Series.DefaultElement.SmartLabel.Font = New Font("Arial", 6)
Chart.Series.DefaultElement.SmartLabel.Text="O:%open-C:%Close"
Chart.Series.Type = SeriesTypeFinancial.CandleStick
Chart.Series.ConnectionString = ConfigurationManager.AppSettings("DNCConnectionString")
Chart.Series.StartDate = New DateTime (2023,6,1,0,0,0)
Chart.Series.EndDate = New DateTime (2023,6,30,23,59,59)
Chart.Series.SqlStatement= "SELECT Transdate,price FROM Financial WHERE Transdate >= #STARTDATE# AND Transdate <= #ENDDATE# ORDER BY Transdate"
Chart.Series.DataFields="xAxis=Transdate,price=price"
Chart.SeriesCollection.Add()
' Create the second chart area
Dim ca2 As ChartArea = New ChartArea()
ca2.LegendBox.Visible = False
ca2.Label.Text = "Stock Volume"
ca2.YAxis.Label.Text = "Number of stocks"
ca2.Series.Name="Stock Volume"
ca2.DateGrouping = TimeInterval.Days
ca2.HeightPercentage = 30
'Add a valume series to the chart area
ca2.Series.ConnectionString = ConfigurationManager.AppSettings("DNCConnectionString")
ca2.Series.StartDate = New DateTime (2023,6,1,0,0,0)
ca2.Series.EndDate = New DateTime (2023,6,30,23,59,59)
ca2.Series.SqlStatement= "SELECT Transdate,volume FROM Financial WHERE Transdate >= #STARTDATE# AND Transdate <= #ENDDATE# ORDER BY Transdate"
ca2.Series.DataFields="xAxis=TransDate,yAxis=Volume"
ca2.Series.DefaultElement.ToolTip="%YValue"
ca2.Series.DefaultElement.Color = Color.FromArgb(219, 203, 24)
ca2.SeriesCollection.Add()
' Add the new area to the chart.
Chart.ExtraChartAreas.Add(ca2)
End Sub
</script>
</head>
<body>
<div style="text-align:center">
<dotnet:Chart id="Chart" runat="server">
</dotnet:Chart>
</div>
</body>
</html>