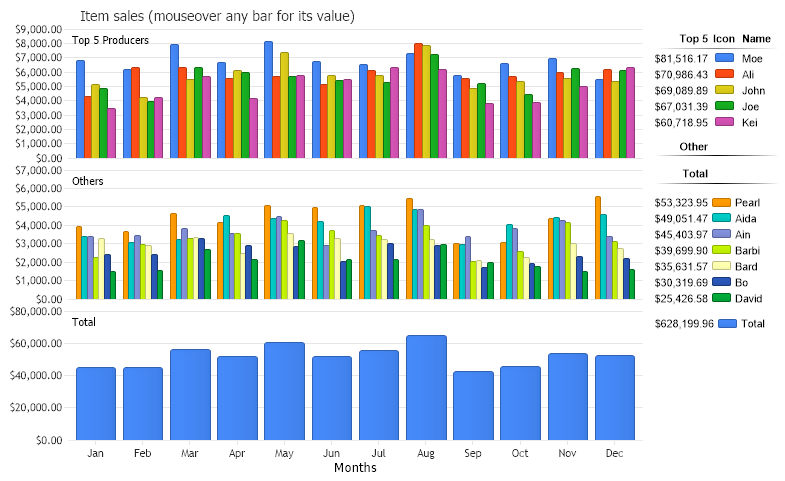
ChartArea DB 2
Demonstrates multiple chart area usage.
<%@ Page Language="C#" Description="dotnetCHARTING Component" %>
<%@ Register TagPrefix="dotnet" Namespace="dotnetCHARTING" Assembly="dotnetCHARTING"%>
<%@ Import Namespace="System.Drawing" %>
<html xmlns="http://www.w3.org/1999/xhtml">
<head>
<title>.netCHARTING Sample</title>
<script runat="server">
void Page_Load(Object sender,EventArgs e)
{
//set global properties
Chart.Title="Item sales (mouseover any bar for its value)";
Chart.ChartArea.XAxis.Label.Text="Months";
Chart.Size = "800X500";
Chart.TempDirectory="temp";
Chart.Debug=true;
Chart.DefaultAxis.FormatString = "c";
//Set a tooltip with series name and value
Chart.DefaultElement.ToolTip = "%SeriesName: %Value";
//Add a series
DataEngine de = new DataEngine();
de.ConnectionString = ConfigurationManager.AppSettings["DNCConnectionString"];
de.StartDate=new DateTime (2022,1,1,0,0,0);
de.EndDate = new DateTime (2022,12,31,23,59,59);
de.DateGrouping = TimeInterval.Year;
// Chart Area 1
Chart.ChartArea.Label.Text = "Top 5 Producers";
de.SplitByLimit = "5";
de.ShowOther = false;
de.SqlStatement= @"SELECT OrderDate,Total, Name FROM Orders WHERE OrderDate >= #STARTDATE# AND OrderDate <= #ENDDATE# ORDER BY Orders.OrderDate";
Chart.LegendBox.HeaderEntry.Visible = true;
Chart.LegendBox.HeaderEntry.Value = "Top 5";
SeriesCollection sc = de.GetSeries();
Chart.SeriesCollection.Add(sc);
// Chart Area 2
ChartArea ca2 = new ChartArea();
de.LimitMode = LimitMode.ExcludeTop;
SeriesCollection sc2 = de.GetSeries();
foreach(Series s in sc2)
s.LegendEntry.SortOrder = 2;
ca2.SeriesCollection.Add(sc2);
ca2.Label.Text = "Others";
de.SqlStatement= @"SELECT OrderDate, Sum(Total) FROM Orders WHERE OrderDate >= #STARTDATE# AND OrderDate <= #ENDDATE# GROUP BY Orders.OrderDate ORDER BY Orders.OrderDate";
de.Limit = "";
Chart.ExtraChartAreas.Add(ca2);
// Chart Area 3
ChartArea ca3 = new ChartArea();
SeriesCollection sc3 = de.GetSeries();
sc3[0].LegendEntry.SortOrder = 4;
sc3[0].Name = "Total";
sc3[0].DefaultElement.ToolTip = "%ElementName Total: %Value";
ca3.SeriesCollection.Add(sc3);
ca3.Label.Text = "Total";
Chart.ExtraChartAreas.Add(ca3);
// Legend Entry Headers
LegendEntry head2 = new LegendEntry("","Other","");
head2.SortOrder = 1;
head2.PaddingTop = 8;
head2.LabelStyle.Font = new Font("Arial",8,FontStyle.Bold);
head2.DividerLine.Color = Color.Black;
Chart.LegendBox.ExtraEntries.Add(head2);
LegendEntry head3 = new LegendEntry("","Total","");
head3.PaddingTop = 8;
head3.LabelStyle.Font = new Font("Arial",8,FontStyle.Bold);
head3.SortOrder = 3;
head3.DividerLine.Color = Color.Black;
Chart.LegendBox.ExtraEntries.Add(head3);
}
</script>
</head>
<body>
<div style="text-align:center">
<dotnet:Chart id="Chart" runat="server" Width="568px" Height="344px">
</dotnet:Chart>
</div>
</body>
</html>
<%@ Page Language="vb" Description="dotnetCHARTING Component" %>
<%@ Register TagPrefix="dotnet" Namespace="dotnetCHARTING" Assembly="dotnetCHARTING"%>
<%@ Import Namespace="System.Drawing" %>
<html xmlns="http://www.w3.org/1999/xhtml">
<head>
<title>.netCHARTING Sample</title>
<script runat="server">
Sub Page_Load(ByVal sender As Object, ByVal e As EventArgs)
'set global properties
Chart.Title="Item sales (mouseover any bar for its value)"
Chart.ChartArea.XAxis.Label.Text="Months"
Chart.Size = "800X500"
Chart.TempDirectory="temp"
Chart.Debug=True
Chart.DefaultAxis.FormatString = "c"
'Set a tooltip with series name and value
Chart.DefaultElement.ToolTip = "%SeriesName: %Value"
'Add a series
Dim de As DataEngine = New DataEngine()
de.ConnectionString = ConfigurationManager.AppSettings("DNCConnectionString")
de.StartDate = New DateTime (2022,1,1,0,0,0)
de.EndDate = New DateTime (2022,12,31,23,59,59)
de.DateGrouping = TimeInterval.Year
' Chart Area 1
Chart.ChartArea.Label.Text = "Top 5 Producers"
de.SplitByLimit = "5"
de.ShowOther = False
de.SqlStatement= "SELECT OrderDate,Total, Name FROM Orders WHERE OrderDate >= #STARTDATE# AND OrderDate <= #ENDDATE# ORDER BY Orders.OrderDate"
Chart.LegendBox.HeaderEntry.Visible = True
Chart.LegendBox.HeaderEntry.Value = "Top 5"
Dim sc As SeriesCollection = de.GetSeries()
Chart.SeriesCollection.Add(sc)
' Chart Area 2
Dim ca2 As ChartArea = New ChartArea()
de.LimitMode = LimitMode.ExcludeTop
Dim sc2 As SeriesCollection = de.GetSeries()
For Each s As Series In sc2
s.LegendEntry.SortOrder = 2
Next s
ca2.SeriesCollection.Add(sc2)
ca2.Label.Text = "Others"
de.SqlStatement= "SELECT OrderDate, Sum(Total) FROM Orders WHERE OrderDate >= #STARTDATE# AND OrderDate <= #ENDDATE# GROUP BY Orders.OrderDate ORDER BY Orders.OrderDate"
de.Limit = ""
Chart.ExtraChartAreas.Add(ca2)
' Chart Area 3
Dim ca3 As ChartArea = New ChartArea()
Dim sc3 As SeriesCollection = de.GetSeries()
sc3(0).LegendEntry.SortOrder = 4
sc3(0).Name = "Total"
sc3(0).DefaultElement.ToolTip = "%ElementName Total: %Value"
ca3.SeriesCollection.Add(sc3)
ca3.Label.Text = "Total"
Chart.ExtraChartAreas.Add(ca3)
' Legend Entry Headers
Dim head2 As LegendEntry = New LegendEntry("","Other","")
head2.SortOrder = 1
head2.PaddingTop = 8
head2.LabelStyle.Font = New Font("Arial",8,FontStyle.Bold)
head2.DividerLine.Color = Color.Black
Chart.LegendBox.ExtraEntries.Add(head2)
Dim head3 As LegendEntry = New LegendEntry("","Total","")
head3.PaddingTop = 8
head3.LabelStyle.Font = New Font("Arial",8,FontStyle.Bold)
head3.SortOrder = 3
head3.DividerLine.Color = Color.Black
Chart.LegendBox.ExtraEntries.Add(head3)
End Sub
</script>
</head>
<body>
<div style="text-align:center">
<dotnet:Chart id="Chart" runat="server" Width="568px" Height="344px">
</dotnet:Chart>
</div>
</body>
</html>