Gallery
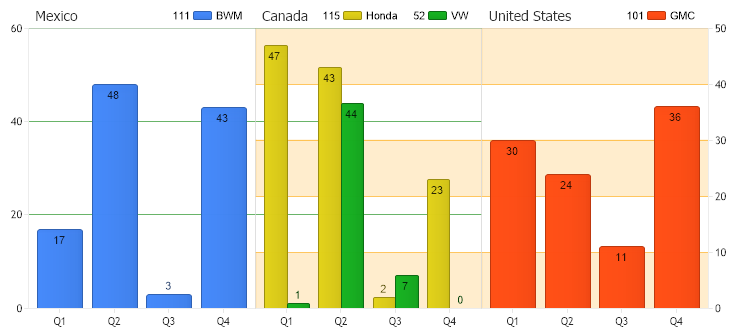
ChartArea Relationships
<%@ Page Language="C#" Description="dotnetCHARTING Component" %>
<%@ Register TagPrefix="dotnet" Namespace="dotnetCHARTING" Assembly="dotnetCHARTING"%>
<%@ Import Namespace="System.Drawing" %>
<html xmlns="http://www.w3.org/1999/xhtml">
<head>
<title>.netCHARTING Sample</title>
<script runat="server">
void Page_Load(Object sender,EventArgs e)
{
Chart.Type = ChartType.Combo;//Horizontal;
Chart.Width = 740;
Chart.Height = 350;
Chart.TempDirectory = "temp";
Chart.Debug = true;
Chart.DefaultElement.ShowValue = true;
Chart.ChartArea.Title = "Mexico";
Chart.TitleBox.Position = TitleBoxPosition.FullWithLegend;
// Demonstrates how chart areas automatically position themselves based on axis relationships.
// *DYNAMIC DATA NOTE*
// This sample uses random data to populate the chart. To populate
// a chart with database data see the following resources:
// - Classic samples folder
// - Help File > Data Tutorials
// - Sample: features/DataEngine.aspx
SeriesCollection mySC = getRandomData();
// First we instantiate 2 axes that we'll use as y axes for our three chart areas.
Axis a1 = new Axis();
Axis a2 = new Axis();
// The grid lines will be have different colors to demonstrate show which chart areas they affect.
a1.DefaultTick.GridLine.Color = Color.FromArgb(150,Color.Orange);
a1.AlternateGridBackground.Color = Color.FromArgb(50,Color.Orange);
a2.DefaultTick.GridLine.Color = Color.FromArgb(150,Color.Green);
// One of the axes will be right oriented. Notice that since the axis works on 2 areas the
// axis is placed on the right most area that the axis appear on.
a1.Orientation = dotnetCHARTING.Orientation.Right;
// Assign our y axes to the 4 series
mySC[0].YAxis = a1;
mySC[1].YAxis = a2;
mySC[2].YAxis = a1;
mySC[3].YAxis = a2;
// Now we'll setup 2 areas. The result will have 3 because the main chart area is also there automatically.
ChartArea ca1 = new ChartArea();
ca1.TitleBox.Label.Text = "United States";
ca1.TitleBox.Position = TitleBoxPosition.FullWithLegend;
ChartArea ca2 = new ChartArea();
ca2.TitleBox.Label.Text = "Canada";
ca2.TitleBox.Position = TitleBoxPosition.FullWithLegend;
// Add the random data. The main area and ca1 each get one series while ca2 gets 2 series. This way
// we'll be placing series with 2 different y axes on ca2.
Chart.SeriesCollection.Add(mySC[1]);
ca1.SeriesCollection.Add(mySC[0]);
ca2.SeriesCollection.Add(mySC[2]);
ca2.SeriesCollection.Add(mySC[3]);
// Add the additional areas to the chart.
Chart.ExtraChartAreas.Add(ca1);
Chart.ExtraChartAreas.Add(ca2);
// Set the layout mode. This mode will ensure the y axes are matched instead of the x axes.
Chart.ChartAreaLayout.Mode = ChartAreaLayoutMode.HorizontalPriority;
}
SeriesCollection getRandomData()
{
SeriesCollection SC = new SeriesCollection();
Random myR = new Random();
for(int a = 1; a < 5; a++)
{
Series s = new Series();
s.Name = "Series " + a;
Element e = new Element();
e.Name = "Q1";
e.YValue = myR.Next(50);
s.Elements.Add(e);
Element e2 = new Element();
e2.Name = "Q2";
e2.YValue = myR.Next(50);
s.Elements.Add(e2);
Element e3 = new Element();
e3.Name = "Q3";
e3.YValue = myR.Next(50);
s.Elements.Add(e3);
Element e4 = new Element();
e4.Name = "Q4";
e4.YValue = myR.Next(50);
s.Elements.Add(e4);
SC.Add(s);
}
SC[0].Name = "GMC";
SC[1].Name = "BWM";
SC[2].Name = "Honda";
SC[3].Name = "VW";
return SC;
}
</script>
</head>
<body>
<div style="text-align:center">
<dotnet:Chart id="Chart" runat="server"></dotnet:Chart>
</div>
</body>
</html>
<%@ Page Language="vb" Description="dotnetCHARTING Component" %>
<%@ Register TagPrefix="dotnet" Namespace="dotnetCHARTING" Assembly="dotnetCHARTING"%>
<%@ Import Namespace="System.Drawing" %>
<html xmlns="http://www.w3.org/1999/xhtml">
<head>
<title>.netCHARTING Sample</title>
<script runat="server">
Sub Page_Load(ByVal sender As Object, ByVal e As EventArgs)
Chart.Type = ChartType.Combo 'Horizontal;
Chart.Width = 740
Chart.Height = 350
Chart.TempDirectory = "temp"
Chart.Debug = True
Chart.DefaultElement.ShowValue = True
Chart.ChartArea.Title = "Mexico"
Chart.TitleBox.Position = TitleBoxPosition.FullWithLegend
' Demonstrates how chart areas automatically position themselves based on axis relationships.
' *DYNAMIC DATA NOTE*
' This sample uses random data to populate the chart. To populate
' a chart with database data see the following resources:
' - Classic samples folder
' - Help File > Data Tutorials
' - Sample: features/DataEngine.aspx
Dim mySC As SeriesCollection = getRandomData()
' First we instantiate 2 axes that we'll use as y axes for our three chart areas.
Dim a1 As Axis = New Axis()
Dim a2 As Axis = New Axis()
' The grid lines will be have different colors to demonstrate show which chart areas they affect.
a1.DefaultTick.GridLine.Color = Color.FromArgb(150,Color.Orange)
a1.AlternateGridBackground.Color = Color.FromArgb(50,Color.Orange)
a2.DefaultTick.GridLine.Color = Color.FromArgb(150,Color.Green)
' One of the axes will be right oriented. Notice that since the axis works on 2 areas the
' axis is placed on the right most area that the axis appear on.
a1.Orientation = dotnetCHARTING.Orientation.Right
' Assign our y axes to the 4 series
mySC(0).YAxis = a1
mySC(1).YAxis = a2
mySC(2).YAxis = a1
mySC(3).YAxis = a2
' Now we'll setup 2 areas. The result will have 3 because the main chart area is also there automatically.
Dim ca1 As ChartArea = New ChartArea()
ca1.TitleBox.Label.Text = "United States"
ca1.TitleBox.Position = TitleBoxPosition.FullWithLegend
Dim ca2 As ChartArea = New ChartArea()
ca2.TitleBox.Label.Text = "Canada"
ca2.TitleBox.Position = TitleBoxPosition.FullWithLegend
' Add the random data. The main area and ca1 each get one series while ca2 gets 2 series. This way
' we'll be placing series with 2 different y axes on ca2.
Chart.SeriesCollection.Add(mySC(1))
ca1.SeriesCollection.Add(mySC(0))
ca2.SeriesCollection.Add(mySC(2))
ca2.SeriesCollection.Add(mySC(3))
' Add the additional areas to the chart.
Chart.ExtraChartAreas.Add(ca1)
Chart.ExtraChartAreas.Add(ca2)
' Set the layout mode. This mode will ensure the y axes are matched instead of the x axes.
Chart.ChartAreaLayout.Mode = ChartAreaLayoutMode.HorizontalPriority
End Sub
Function getRandomData() As SeriesCollection
Dim SC As SeriesCollection = New SeriesCollection()
Dim myR As Random = New Random()
For a As Integer = 1 To 4
Dim s As Series = New Series()
s.Name = "Series " & a
Dim e As Element = New Element()
e.Name = "Q1"
e.YValue = myR.Next(50)
s.Elements.Add(e)
Dim e2 As Element = New Element()
e2.Name = "Q2"
e2.YValue = myR.Next(50)
s.Elements.Add(e2)
Dim e3 As Element = New Element()
e3.Name = "Q3"
e3.YValue = myR.Next(50)
s.Elements.Add(e3)
Dim e4 As Element = New Element()
e4.Name = "Q4"
e4.YValue = myR.Next(50)
s.Elements.Add(e4)
SC.Add(s)
Next a
SC(0).Name = "GMC"
SC(1).Name = "BWM"
SC(2).Name = "Honda"
SC(3).Name = "VW"
Return SC
End Function
</script>
</head>
<body>
<div style="text-align:center">
<dotnet:Chart id="Chart" runat="server"></dotnet:Chart>
</div>
</body>
</html>
- Sample FilenameChartAreaRelationships.aspx
- VersionLegacy (Pre 3.0)
- Uses DatabaseNo